The Cost of Voting, and Who Picks Up the Tab
Introduction
Voting is generally regarded as a universal right, but for an increasing number of Americans it is becoming an unaffordable luxury. Ever since the Supreme Court invalidated a key section of the Voting Rights Act in their 2013 decision Shelby County v. Holder, states no longer need to seek federal approval when modifying their voting laws. Previously regulated states such as Texas, Alabama, and Georgia have since implemented strict voting I.D. laws and poll closures that have been shown to disproportionately affect minority and Democratic voters. One study published in the weekly magazine The Nation found that Wisconsin’s voter I.D. law reduced voter turnout by around 200,000 votes in 2016. Donald Trump won the state by less than 23,000 votes.
Barriers to voting must be considered in any model that purports to predict national elections. Luckily, researchers have developed a single metric called the Cost of Voting Index (CoVI) that uses a variety of factors to calculate the difficulty of voting in any given state. In this article, we discuss the effect that this metric has on our predictions, as well as flaws in our model that stem from a failure to give adequate weight to the CoVI.
Why the CoVI is important
Voting shouldn’t cost an arm and a leg. It is the backbone of democracy, allowing citizens to make their voices heard. Yet, states still have voting restrictions that make it hard for some to vote. During the COVID-19 pandemic, voting accessibility has been an evident issue and states have implemented new policies that have either raised or lowered their cost of voting. But even in a normal election year, barriers such as strict voter ID laws, early registration deadlines, and the inability to get time off from work on election day prevent many from being able to participate in this paramount political process.
Thus, we must account for CoVI in election models. As in the case of Wisconsin in 2016, the fact that the number of voters suppressed by just voter I.D. laws is far greater than the margin of victory shows how impactful CoVI is to the election. To get a sense of how pervasive voter suppression is, according to the American Civil Liberties Union (ACLU), for voter ID laws alone, 11% of voting age US citizens do not have IDs, which means 21 million American citizens are blocked from voting. These suppressed voters have the ability to swing a national election. Moreover, 25% of voting age Black citizens lack an ID while only 8% of their white counterparts lack one; voting laws are discriminatory towards minorities. It would be a grave oversight not to account for CoVI.
How is Cost of Voting quantified?
A cost of voting index is generally a numerical value that indicates the level of difficulty, whether perceived or physical, for a voter to cast a ballot. The cost of voting for each state varies from year to year because of the state and the federal government’s ability to determine registration and voting laws.
The idea of a Cost of Voting Index has been around for a while. The first equation was developed in 1968 by political scientists William Harrison Riker and Peter Carl Ordeshook. This equation was R = (BP - C), where R = reward of voting, C = cost of voting, B = differential benefit a voter personally receives from their candidate winning, P = probability of that voter’s vote determining the election’s outcome. P is generally almost zero, creating a “voting paradox” in which actual turnout is much higher than the equation predicts, as a negative R value indicates the cons of voting outweigh the pros. Since P is generally very low, they later added a positive term D to the right side, representing the social and personal benefits that come from voting, such as signaling support for a candidate or demonstrating civic responsibility.
The methodology for calculating the Cost of Voting has become much more complex since then.
Methodology for the CoVI we used in our model:
Every election year since 1996, researchers Quan Li, Michael J. Pomantell, and Scot Schraufnagel calculate a CoVI for each state to determine how easy or difficult it is to cast a vote in that state. A positive value CoVI indicates a high difficulty in voting, whereas a negative value CoVI implies few barriers to casting a vote.
The researchers base their calculations off of state election laws and policies, which they split into seven different categories as shown in the list below. Each bullet point is one of the seven factors along with an indicator to how the data is numerically included in their calculations. The numbered items list types of statewide policies that they take into account.
Registration deadline - standalone ratio value: number of days prior to election that registration must occur
Registration restrictions - additive indicator (count the # of policies)
- Same day registration not allowed
- Felons not allowed to register
- No online registration
- Mental competency requirements
- No automatic voter registration
- Registration drive restrictions - additive indicator
- Official certification required by state
- Required state training courses
- Required document submission
- Penalties for deadline or rule violations
- Preregistration (before 18th birthday) laws (0-5 scale, where 0 is 16-year-olds can register and 5 is no pre registration before the age of 18)
- Voting inconvenience - additive indicator
- No early voting
- No time off from work (with or without pay) for voting
- Required excuse for absentee voting
- No in-person absentee voting
- Reduced number of polling stations
- No all mail voting
Voter ID laws (0-4 scale, where 0 is no ID required and 4 is photo ID strictly enforced)
Poll hours - standalone ratio variable: Takes into account # of hours polls stay open
The researchers then use a method called Principal Component Analysis (PCA) which uses orthogonal matrix transformations to convert their collection of interrelated variables into a number of uncorrelated components.
The first component accounts for as much of the variance in the data as possible, or in statistics language, has the highest R-squared value possible. The rest of the components are calculated such that they each account for the most variance possible while still staying completely orthogonal, or independent, from each of the other components.
Once the components are determined, they are weighted relative to their R-squared values and combined to obtain the final CoVI value. Although the researchers’ expressed the CoVI as a positive or negative value in between -1 and 1, we added a constant to each value to make them all positive for the sake of easier calculations within our model.
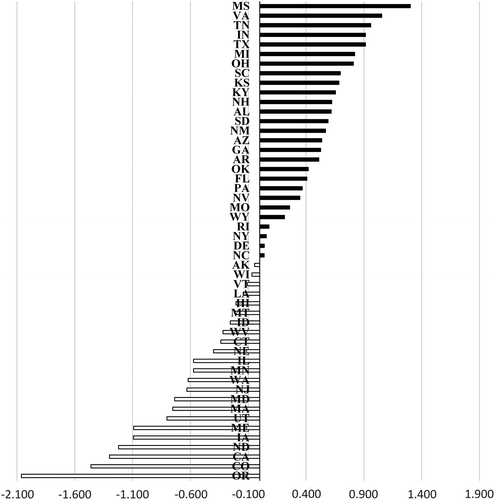
In 2016, which is when the CoVI values that we used in our model were released, Mississippi, Virginia, and Tennessee were ranked as the states with the highest cost of voting while Oregon, Colorado, and California ranked as the easiest states in which to vote. Below are all of the CoVI values for 2016.

How does the CoVI impact our model?
The CoVI is used in our model to add additional variance to each state based on the following formula:
$${\frac{0.6(CoVI + 2.06)}{400}}$$
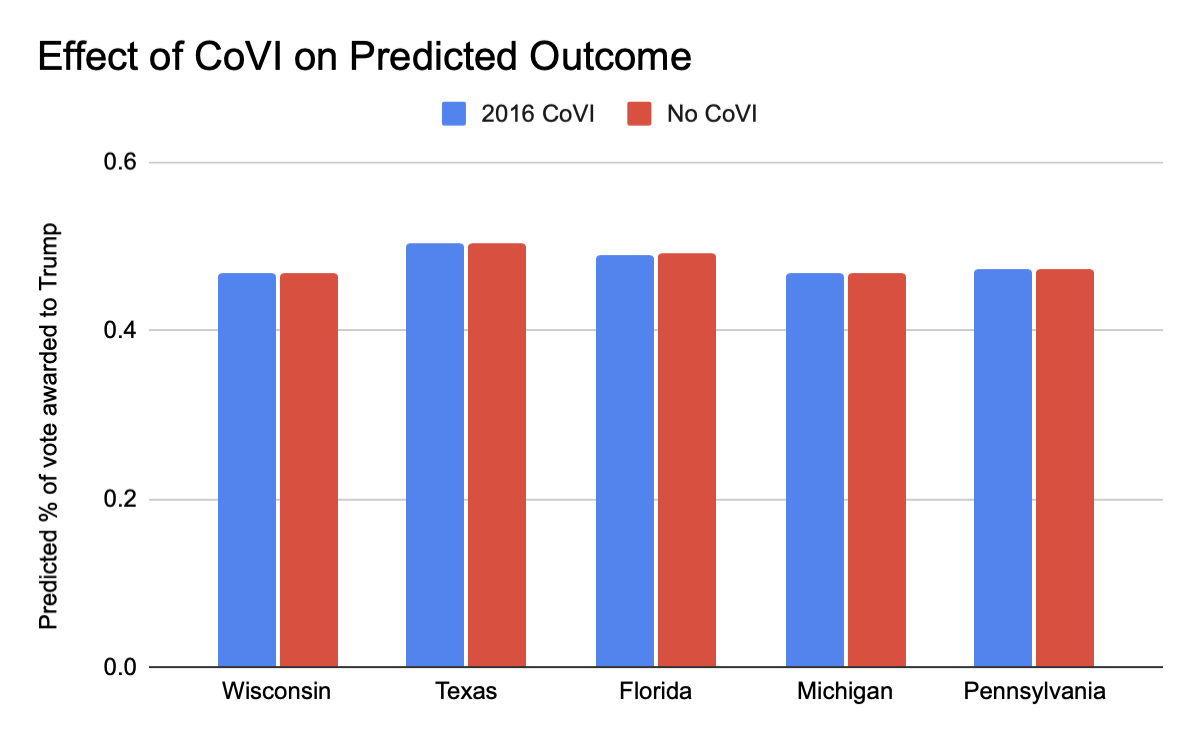
The constant 2.06 is added in order to make the CoVI for each state positive, and the resulting value is multiplied by a constant and added to each states’ variance. In theory, this should increase the overall uncertainty in our model, making it slightly less influenced by changes to polls and demographics. To determine how much of an impact the CoVI has on our model’s state-by-state predictions, we ran the model twice: once including the CoVI in each state’s variance like normal, and once without taking the CoVI into consideration at all. Here were our results:

As you can see, the way in which we have included CoVI in our model makes almost no noticeable difference in our state predictions. In fact, the difference is not statistically significant at all, for any of the states shown in this graph (p > .99).
There are two possible explanations for this lack of significance. The first explanation is that the CoVI values in 2016 simply weren’t high enough to have a real impact. In other words, the barriers to voting that existed in 2016 had no impact on the electoral results of individual states.
A second explanation is that the difference is so small because we failed to include the CoVI in our model in a meaningful way. It’s possible that we simply weighted it too low, leading to an added variation so small that it became irrelevant in the grand scheme of our model. Based upon studies like the one described in the introduction of this article that demonstrate the large impact of certain voting policies on election turnout, it is reasonable to believe that the second explanation is best suited to explain our results.
Notably, the 538 Election model also uses the CoVI in its predictions, but they factor CoVI into their partisan lean index, which describes a state’s tendency to vote for one party over another. Because it is generally believed that reduced voter turnout favors Republican candidates, predictions for states with a high CoVI are shifted towards the Republican candidate. How exactly CoVI factors into their formulas is not publicly available, but we felt it relevant to note that their method of accounting for it is significantly different from ours.
How did COVID impact CoVI?
The act of voting has changed this year in a way that many other things in 2020 have changed: dramatically and unequally. While some Americans are enjoying expanded early voting and ballots mailed to their doorstep, others struggle with limited mail-in ballot availability, ballot drop boxes that are few and far between, and early voting lines that last for hours. Because of this, a new cost of voting metric was recently released, the CCoVI, or Coronavirus Cost of Voting Index. We ran our model using the CCoVI instead of the CoVI from 2016 to see if this would impact our results.
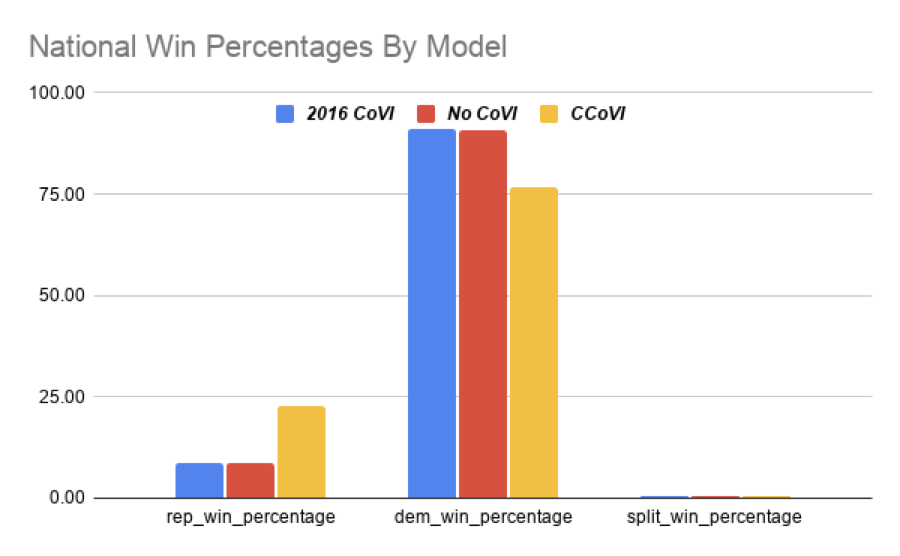
National Win Percentages by Model
2016 CoVI No CoVI CCoVI Rep. Win % 8.67 8.73 22.77 Dem. Win % 90.96 90.91 76.64 Split Win % 0.36 0.36 0.60

We found that the CCoVI affected the model much more than the CoVI, raising the chance of a Republican victory from 8.7% to 22.8%. We were surprised by how large an effect this had on our model, though it is likely warranted due to just how different this year is from other years. Research has shown that Democrats are much more likely to vote by mail due to the coronavirus, so states with complicated methods of requesting ballots or that are dropbox only will likely see lower Democrat turnout. Our model is consistent with this assumption, as shown in the table below.
Change in Republican Win % Between Models by State
Note: This table shows the difference in number of percentage points in the Republican candidate's the win probability for that state. As an example, an increase of 7.85% in Maryland's "CCoVI - 2016" column means that if we used the CCoVI metric in our model instead of the 2016 CCoVI, Trump's win probability in Maryland would increase from 1% to 8.85%
State 2016 - No CoVI CCoVI - 2016 CCoVI - No CoVI Alabama -0.02% 5.59% 5.57% Alaska -0.07% 4.96% 4.88% Arizona -0.12% -4.07% -4.19% Arkansas 0% 0.23% 0.23% California 0.01% 7.1% 7.12% Colorado -0.02% 6.9% 6.88% Connecticut 0.02% 3.8% 3.82% Delaware -0.01% 8.57% 8.55% D.C. 0% 0% 0% Florida -0.1% 4.7% 4.6% Georgia 0.03% -16.6% -16.57% Hawaii 0.01% -0.47% -0.46% Idaho -0.02% 0.72% 0.7% Illinois -0.03% 2.19% 2.15% Indiana 0% 5.75% 5.75% Iowa 0% 7.13% 7.13% Kansas 0.03% 4.95% 4.98% Kentucky 0.02% 2.69% 2.71% Louisiana -0.02% 5.59% 5.57% Maine -0.07% 4.95% 4.88% Maine CD-2 -0.02% 3.91% 3.89% Maryland 0% 7.85% 7.85% Massachusetts 0.02% 8.53% 8.55% Michigan -0.01% 4.7% 4.7% Minnesota 0.01% 0.7% 0.71% Mississippi -0.09% 4.95% 4.86% Missouri 0% 7.78% 7.78% Montana 0.08% 12.79% 12.88% Nebraska 0.02% 4.39% 4.41% Nebraska CD-2 0% 4.49% 4.49% Nevada -0.02 1.89% 1.87% New Hampshire 0.03% 7.24% 7.27% New Jersey 0% -4.95% -4.94% New Mexico 0.01% 5.58% 5.59% New York -0.06% -0.4% -0.46% North Carolina 0.13% 16.44% 16.57% North Dakota 0.01% 0.07% 0.09% Ohio 0.05% 0.33% 0.38% Oklahoma 0% -0.28% -0.28% Oregon 0% 8.17% 8.17% Pennsylvania -0.01% 4.68% 4.67% Rhode Island 0.08% 7.11% 7.19% South Carolina -0.02% 2.38% 2.36% South Dakota 0.08% 10.78% 10.86% Tennessee -0.03% 1.82% 1.78% Texas -0.01% 2.43% 2.42% Utah 0% 11.35% 11.35% Vermont 0.06% 1.75% 1.8% Virginia 0.03% -0.08% -0.06% Washington -0.06% 2.71% 2.65% West Virginia -0.03% -3.33% -3.36% Wisconsin 0.04% 0.05% 0.09% Wyoming -0.05% 7.48% 7.43%
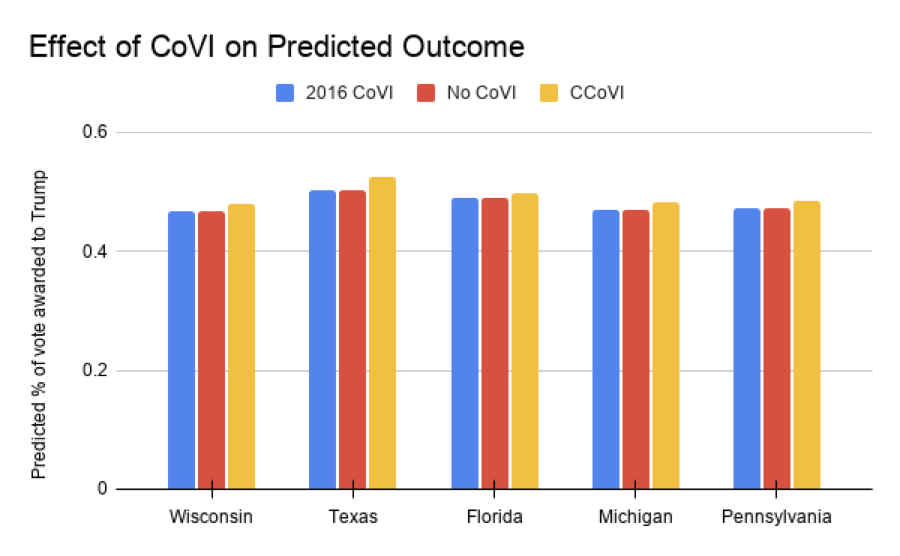
Using the CCoVI significantly impacted several battleground states. We looked at five battleground states, all of which predicted an increase in the vote for Trump when using the CCoVI. Texas had the largest increase, predicting that an additional 2.2% of the vote would go to the Republicans.

Even though we do not attach partisan significance to the CCoVI in our model, the added CCoVI-induced variance increased the likelihood of a Trump victory by introducing more uncertainty into battleground states that currently lean slightly toward Biden in our model.
We do not account for the impacts of the coronavirus at all in our model, even though it will likely influence people's willingness and ability to vote. Coronavirus has also contributed to public opinion of the current president, which is reflected in polls, but other than that it is wholly unaccounted for in the model.
Conclusion
These results lead us to believe that our model should account for the cost of voting in a more significant way. We also think that it may be misleading to suggest that the cost of voting only creates variance, since it has been shown to specifically benefit Republican candidates. We hope that the increased voting options states are providing this year become the new norm, and that restrictive or confusing voter laws are removed to both increase voter turnout and overall democracy.
References
Berman, A. (2017, May 09). Wisconsin's Voter-ID Law Suppressed 200,000 Votes in 2016 (Trump Won by 22,748). Retrieved October 29, 2020, from https://www.thenation.com/article/archive/wisconsins-voter-id-law-suppressed-200000-votes-trump-won-by-23000/
Li, Q., Pomante, M. J., & Schraufnagel, S. (2018). Cost of Voting in the American States. Election Law Journal: Rules, Politics, and Policy, 17(3), 234-247. doi:10.1089/elj.2017.0478 Oppose Voter ID Legislation - Fact Sheet. (n.d.). Retrieved October 29, 2020, from https://www.aclu.org/other/oppose-voter-id-legislation-fact-sheet
Parisi, —. (n.d.). New study scrutinizes time and effort it takes to vote in each state. Retrieved October 29, 2020, from https://newsroom.niu.edu/2018/09/25/new-study-scrutinizes-time-and-effort-it-takes-to-vote-in-each-state/
Salame, R. (2020, March 02). Texas closes hundreds of polling sites, making it harder for minorities to vote. Retrieved October 29, 2020, from https://www.theguardian.com/us-news/2020/mar/02/texas-polling-sites-closures-voting?fbclid=IwAR0U_LPUDby8m5BPRct50duxmI2x3nSSGwvhQZ0eysfClZMUprKoWnA0VeU
Schraufnagel, S., Pomante, M. J., & Li, Q. (2020). Cost of Voting in the American States: 2020. Election Law Journal: Rules, Politics, and Policy. doi:10.1089/elj.2020.0666
