Comparing How Toss-up States Affect the Election in the FiveThirtyEight and ORACLE Models
Introduction
Conditional probability is the probability that event B occurs given the knowledge that event A has already occurred; P(A | B) can be read as: “the probability of A given B.” As long as the two events are not independent, it makes sense to calculate how one event occurring impacts the other. Election results in separate states are not independent events because results in one state can be a strong predictor for how states with similar demographic make-ups will vote in the election. The Blair ORACLE and FiveThirtyEight election models both account for the effect of Trump winning one state as a factor that affects other states. Thus, conditional probabilities serve as an indicator of the overall election outcome by forecasting outcomes if a candidate wins a particular state; this can be visualized as P(Candidate wins election | Candidate wins [state]).
In this post, we will compare how the Blair ORACLE and FiveThirtyEight election outcome predictions shift for the conditional probability that Trump wins the electoral votes in each of six key toss-up states — Arizona, Florida, Iowa, North Carolina, Ohio, and Texas. These states have regularly seen close contests over the last few presidential campaigns and play a major role in determining who will ultimately win the election.
Methodology
To determine the conditional probability of Trump winning the election given that Trump wins particular states, we set each state to vote Trump 100% of the time throughout 40,000 simulations. Although we didn’t adjust the variance of the model, meaning there is a miniscule chance Biden wins a “100% Trump state”, it is insignificant in the grand scheme. The prediction made each time the simulation was run would differ due to the natural variance of results in the other states, and the demographic weighting of that state’s results on other states.
This contrasts from FiveThirtyEight's conditional probability model. First, FiveThirtyEight performs their analysis on a subset of 40,000 daily simulations such that, given a set of state outcomes, simulations that do not match those criteria are excluded. Specifically, the subset of simulations in which Biden won each tossup state was excluded in calculating the results. FiveThirtyEight also has a method for the case where there is not enough data left to make conclusions, but that did not come into play in our analysis. Our method differs here because our method has 40,000 simulations whereas FiveThirtyEight's always has less than 40,000 simulations.
Results and Analysis
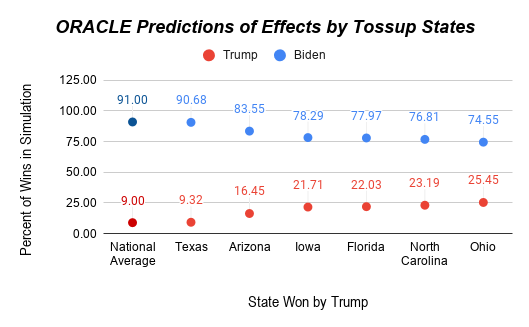
According to ORACLE, the least to most impactful states in the election are ranked as follows: Texas, Arizona, Iowa, Florida, North Carolina, and Ohio. Winning Ohio raises Trump's chances of winning the election more than any other state we looked at.
| ORACLE (10/18) | Trump Win % | Biden Win % | Increase in Trump Win % |
|---|---|---|---|
| Current National Average | 9.00 | 91.00 | |
| Arizona | 16.45 | 83.55 | 7.45 |
| Florida | 22.03 | 77.97 | 13.03 |
| Iowa | 21.71 | 78.29 | 12.71 |
| North Carolina | 23.19 | 76.81 | 14.19 |
| Ohio | 25.45 | 74.55 | 16.45 |
| Texas | 9.32 | 90.68 | 0.32 |
Table 1. Showing ORACLE’s conditional predictions depending on the state won by Trump with simulations run on 10/18.
 Figure 1(a). Shows the ORACLE prediction of the election based on conditional probabilities of the states, ranked from least effect to most effect from left to right.
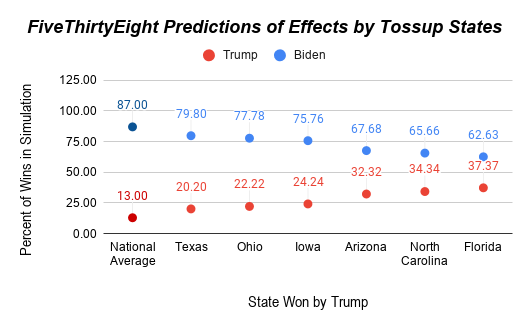
According to FiveThirtyEight, the least to most impactful states in the election are ranked as follows: Texas, Ohio, Iowa, Arizona, North Carolina, and Florida. Winning Florida raises Trump's chances of winning the election more than any other state we looked at.
| FiveThirtyEight (10/25) | Trump win % | Biden win % | Increase in Trump win % |
|---|---|---|---|
| Current National Average | 13.00 | 87.00 | |
| Arizona | 32.32 | 67.68 | 19.32 |
| Florida | 37.37 | 62.63 | 24.37 |
| Iowa | 24.24 | 75.76 | 11.24 |
| North Carolina | 34.34 | 65.66 | 21.34 |
| Ohio | 22.22 | 77.78 | 9.22 |
| Texas | 20.20 | 79.80 | 7.20 |
Table 1(b). Shows FiveThirtyEight's conditional predictions depending on the state won by Trump with simulations run on 10/25.
 Figure 1(b). Shows the FiveThirtyEight prediction of the election based on conditional probabilities of the states, ranked from least effect to most effect from left to right.
Comparisons
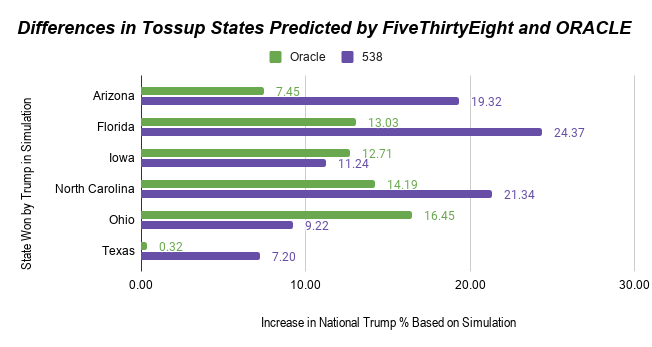
 Figure 2. Shows the differences by ORACLE and FiveThirtyEight in the increase of Trump’s win percentage depending on the conditional probability of the state.
One apparent difference between the two models was the size of effect on the election predictions. In general, the FiveThirtyEight model places more weight on the effects of Trump winning the general election based on the effects of the key states, but this may be the reason why the FiveThirtyEight model lists most of the states we analyzed as “key states” in the first place. This is particularly evident in the case of Texas, where the effect of Trump winning Texas is 22 times larger in the FiveThirtyEight model than the ORACLE one. The ORACLE model predicts a negligible effect for Texas, which is unusual given that Texas is considered a battleground state. Overall, Ohio is the only state which ORACLE predicts has a much greater effect than FiveThirtyEight.
A potential reason for this difference is that ORACLE and FiveThirtyEight have different methods for correlating results between states. The ORACLE ran a regression for each state against all other states with seven informative demographics —the percentage of non-hispanic white residents, percentage of black residents, percentage of hispanic residents, percentage of nonreligious residents, urbanicity, median age, and percentage of residents that have a college degree— as predictors and stored the outputs in a square matrix. It then calculates a net effect posed by each state onto every other state based on their demographic similarity. FiveThirtyEight accounts for state correlation with demographics and geography. For demographics, it runs regressions using all possible combinations of race, socioeconomic status, liberal-conservative, religious affiliation and urbancity. Then, it weights these 360 regressions based on their performance. The highest correlations with the least variables receive the most weight, but every correlation receives some weight. In addition to demographics, a key difference between state correlations comes from the fact that the FiveThirtyEight model uses geographic predictors. If one candidate wins a state, the prediction for other states in the proximate region will increase for that candidate. Even though geographic locations are weighted less than demographics in state correlations, the difference may explain the results we are seeing.
Besides different state correlation weighting, the models also differ on how the conditional probabilities were run during the simulation. The FiveThirtyEight model uses a subset of the 40,000 simulations to determine conditional probability while ORACLE ran 40,000 simulations on each state. This makes the FiveThirtyEight model slightly more volatile, or extreme, towards the effect of states on the election, which was seen in the results.
References
ORACLE of Blair. (2020, October 18). [Blair High School 2020 Presidential Election Predictions]. Retrieved October 18, 2020 from https://polistat.mbhs.edu/ ORACLE of Blair. (n. d). [https://polistat.mbhs.edu/methodology/] Retrieved October 28, 2020 from https://polistat.mbhs.edu/ Silver, N. (2020, October 25). How FiveThirtyEight Calculates Pollster Ratings. FiveThirtyEight. Retrieved October 25, 2020, from https://projects.fivethirtyeight.com/trump-biden-election-map/ Silver, N. (2020, August 12) How Our Primary Model Works. FiveThirtyEight. Retrieved October 28, 2020 from https://fivethirtyeight.com/features/how-fivethirtyeight-2020-primary-model-works/.
