Analyzing the Relationship Between Cost of Voting and Partisan Lean
Background
Though every US citizen above 18 is entitled to a vote, each state has its own set of rules which make it more or less difficult to actually place a vote. Various factors influence the ease of voting—for instance, stricter voter id laws make it harder to vote, raising what’s called the cost of voting, while flexible laws governing absentee and early voting lower the cost of voting. Having a lower cost of voting generally encourages higher voter turnout in elections.
Voter suppression, through various practical and policy changes which raise cost of voting, has a long history in America. The Republican party is currently making many efforts to raise that cost, through efforts that include trying to disallow mail-in ballots that arrive after Election Day, suing to stop counting absentee ballots, and limiting drop-off boxes for mailed ballots to one per county in Texas. Other efforts, like the creation of fake ballot boxes in California, also serve to suppress the vote. Often, these measures are done in the name of preventing voter fraud.
While voter suppression is exacerbated during a pandemic in which many are wary of in-person voting, it is far from new. These issues tend to see Republicans on one side, raising cost of voting in attempts to “prevent voter fraud,” with Democrats trying to reduce the cost of voting. This is, naturally, a partisan game: Republicans believe that by raising the cost of voting, they can discourage more Democratic potential voters from voting.
To that end, we are looking at the relationship between changes in cost of voting and shifts in the Republican percentage of the two-party vote in order to examine if higher costs in voting do indeed correlate with higher Republican votes—which would justify Republican behavior as rational, if not moral.
Methodology
In 2016, Li, Pomante, and Schraufnagel calculated the Cost of Voting in all 50 states for the presidential elections in 1996, 2000, 2004, 2008, and 2012. The variables they used were restrictions on voter registration, considering the number of days prior to Election Day that voters must register and whether Election Day registration was permissible at all, some, or no polling places, registration drive restrictions, absentee voting limits, identification requirements, and poll hour restrictions.
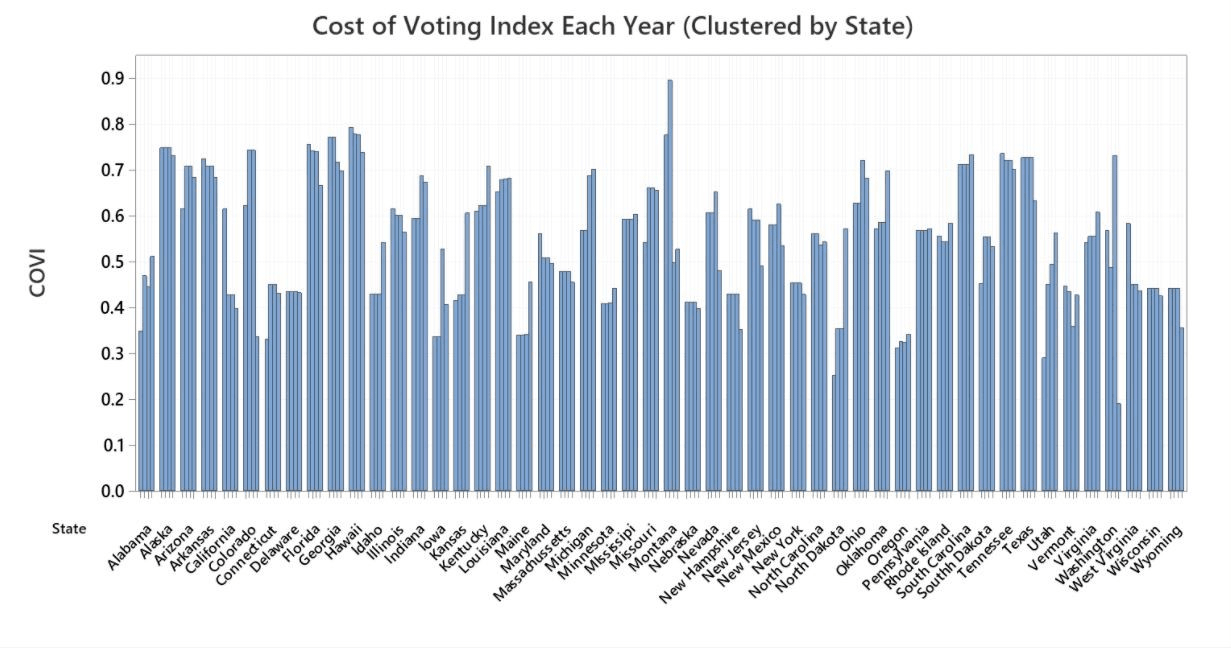
We compiled these indices with the Republican two-party vote share, using data provided by the Federal Election Commission, in a spreadsheet. Then, we calculated the differences in both the Cost of Voting Index and the Republican two-party vote share for all states between each election, thus looking at the years 2000, 2004, 2008, 2012. The figure below shows the Cost of Voting Index (not the change, but the actual Cost of Voting Index) every four years from 2000 to 2012, clustered by state.

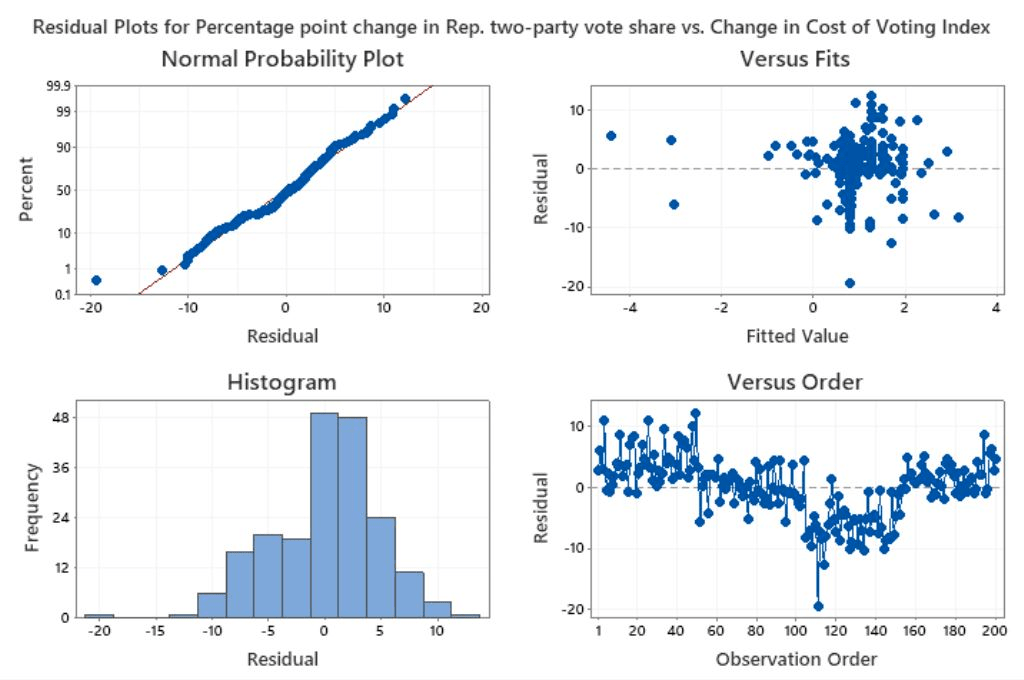
Lastly, we performed a regression on the differences -- thus looking at changes from 2000 to 2012 -- to assess the effect of changes to the Cost of Voting Index on the Republican two-party vote share relative to the previous presidential election. In order to ensure that the data were approximately normal, we looked at the residual plots, which are included below.

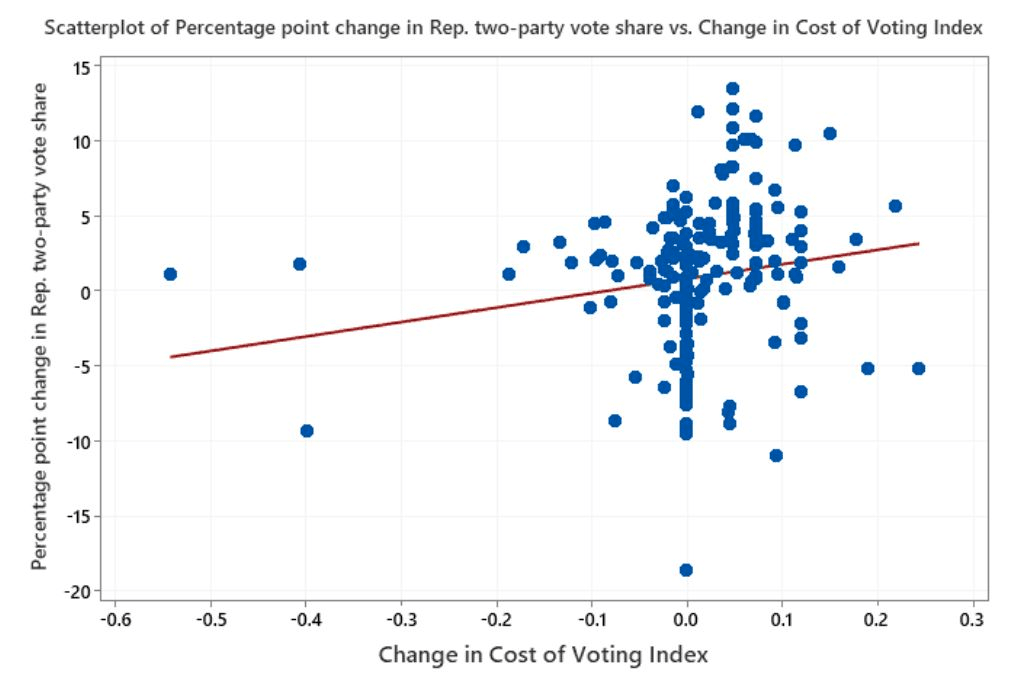
After regression, we obtained the following equation: y=0.814 + 9.61 * COV. This means that for every one point increase in the Cost of Voting Index for a given state relative to that of the previous election, we expect the Republic two-party vote share to be 9.61 percentage points greater than it was for that state in the previous presidential election. The figure below is a scatterplot comparing the Change in the Cost of Voting Index with the percentage point change in the Republican two-party vote share; the line of best fit as obtained from the regression is shown in the middle, colored in red.

As is visible from this figure, there is a wide spread within the scatterplot, and the regression is just in the middle of all the data. Accordingly, the r-squared value is 2.66%. This means that 2.66% of the variation in the percentage point change of the Republican two-party vote share is accounted for by the change in the Cost of Voting Index from the previous presidential election. There are no visible patterns in the residual plots, either, so we can conclude that Change in Cost of Voting Index does not have a strong effect on the percentage point change in Republican two-party voter share relative to the most recent presidential election. Change in the Cost of Voting Index is not a good predictor for the Republican two-party vote share.
Because of the virtually nonexistent correlation between changes in cost of voting and changes in the Republican share of the two-party vote, it seems illogical that the Republican party goes to such extremes to increase the cost of voting.
References
Ingraham, C. (2018, October 22). Low voter turnout is no accident, according to a ranking of the ease of voting in all 50 states. The Washington Post. https://www.washingtonpost.com/business/2018/10/22/low-voter-turnout-is-no-accident-according-ranking-ease-voting-all-states/
Leip, D. (n.d.). National election results. Atlas of U.S. Presidential Elections. https://uselectionatlas.org/RESULTS/national.php?f=0&off=99
Leonhardt, D. (2020, October 28). The morning. The New York Times. https://messaging-custom-newsletters.nytimes.com/template/oakv2?uri=nyt://newsletter/b00ce698-7253-59e8-9a25-49edccb28b01&productCode=NN&abVariantId=0&te=1&nl=the-morning&emc=edit_nn_20201031
Li, Q., Pomante, M. J., II, & Schraufnagel, S. (2016, May 19). The cost of voting in the American states: Creating a comprehensive index. https://www.utdallas.edu/sppc/pdf/LiPomanteSchraufnagelSPPC2016.pdf
