How Does The Cost Of Voting Affect Our Prediction Of The Election?
What makes a state harder to vote in?
The ability for an American who is trying to exercise their right to vote can possibly come down to where they live. Some American states have enacted policies that make it easier, or harder to vote in their state. Of the 50 states, 13 of them, like Oregon, Washington, and California do not require an ID of any kind to vote. 12 states, including Pennsylvania and Colorado require identification, but no photo ID. 7 states have no strict photo identification like Nevada and Utah. And the other 18 states, some being Texas, Alabama, and Tennessee, have very strict photo ID requirements. With a few outliers, states that tend to vote Democratic, are more lenient with identification, and states that tend to vote Republican, are very strict about voter identification.
We examined the Cost of Voting Index (COVI) which ranks the difficulty of voting in every state. Given that it is more difficult to vote in some states than others, and most of the states where it is more difficult being Republican states in the South, if COVI was forgotten, and each state was equally difficult to vote in, could this alter the result of an election?
 Figure 1: This is Oracle of Blair’s Predicted Outcome. Red meaning Trump is winning significantly, Blue meaning Biden is winning significantly. Gray meaning Trump and Biden are close.
 Figure 2: This diagram shows the Cost of Voting Rankings for each state.
Results and Comparisons
We compared the predicted outcome of every state with their current COVI to the outcome of every state with every state’s COVI at 0. We compared states from each group (based on identification levels needed to vote) and analyzed how COVI or the lack of thereof, could change the election.
 Figure 3: This graph shows the effect of removing COVI from all states towards Trump's predicted vote for states 1-25.
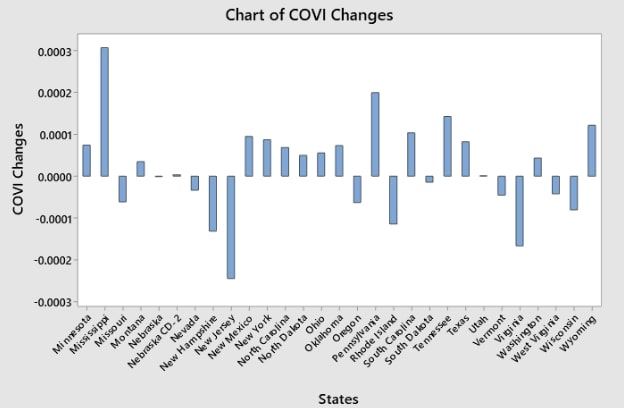 Figure 4: This graph shows the effect of removing COVI from all states towards Trump's predicted vote for states 26-53.
With the Cost of Voting Index, Texas—the hardest state to vote in— was won by Trump in 50.29% of the simulations. Without COVI, Trump won 50.28% of simulations in Texas. Another state where you are strictly required to provide a photo ID requirement, Alabama, went to Trump 59.64% of the simulations with the COVI included. Without it, Trump took 59.63%. In states that don’t require an ID to vote like Oregon and Washington, and taking COVI into account, Biden won the election simulations 57.29% and 58.7% of the time, respectively. With no COVI taken into account Biden won Oregon by 57.3% and Washington by 58.7%.
 Figure 5: This graph shows the effect of removing COVI from Alabama, Texas, Oregon, Washington towards Trump's predicted vote.
Analysis
It is clear that there are obvious trends between the difficulty of voting in each state, and which party the state tends to favor, however the Cost of Voting Index has no significant effect on the election. Removing COVI from our model can change a state’s outcome by 0.02% in favor of either candidate. It would obviously be better if the most possible people could vote in every election and each state was easier to vote in. However, the overall outcome of each state relies very little on the Cost of Voting Index.