Does the Demographic Correlation Between States Affect Voting Trends?
Introduction
What was once a white majority country has now become mixed with various demographics. Demographic composition often affects voting patterns, as most voters have a preference for candidates who support policies that benefit their demographic. According to statista.com, women voters and non-white voters heavily favor Biden, while male voters, white voters, and non-college educated voters significantly favor Trump more than Biden. These demographics will likely continue to be steady rocks for their respective candidates. However, the number of demographics supporting each candidate is less important than the demographic distribution of voters within each state, since the electoral college will also play a big role in the results of the election.
According to Oracle State Correlations and Relationships (OSCAR), there are some shockingly high demographic correlations between states. The demographics of Wisconsin and Michigan, for example, have an approximate correlation of 0.9596, while Ohio and Michigan are correlated by 0.9967. A plausible reason for the high correlation can be illustrated by Texas, which was once heavily Republican but has been turning purple due an increasing population of minorities (theatlantic.com). This influx of certain populations can also be attributed to several other states, such as California, Hawaii, New Mexico, Nevada, Maryland, and Georgia (governing.com). For this reason, we consider whether demographic correlation affects voting trends.
Dynamics that create swing states during elections include population changes (described above), ideological polarization, and moderate politics (history.com). Swing states, otherwise known as battleground states, are particularly important to presidential candidates, as these states can reasonably be won by either the Democratic or Republican candidate. Thus, we focus on the battleground states in our analysis.
The battleground states in the 2016 election were Colorado, Florida, Iowa, Michigan, Nevada, New Hampshire, North Carolina, Ohio, Pennsylvania, Virginia and Wisconsin. Out of these, Trump lost only four: Colorado, Nevada, New Hampshire, and Virginia. States he won include Florida, Iowa, Michigan, North Carolina, Ohio, Pennsylvania, and Wisconsin. Four out of these states were narrow wins: Florida, Michigan, Wisconsin, and Pennsylvania. Trump dominated in Iowa, North Carolina, and Ohio.
Methodology
Using data from OSCAR, we took the battleground states that Trump won in 2016 and analyzed which of those states were correlated from 0.95 to 1.0 or -0.95 to -1.0, shown in the table below.
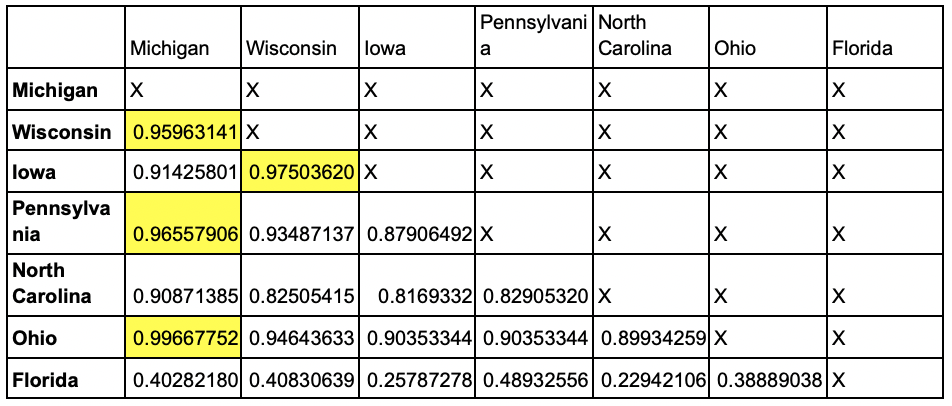
Table 1: Demographically correlated states. Cells that were the intersection of states with a 0.95 to 0.1 or -0.95 to -0.1 correlation to each other are highlighted. Repeated cells are marked with an X (e.g., Wisconsin & Iowa versus Iowa & Wisconsin).
Then, we took data from RealClearPolitics and analyzed individual voting trends of demographically correlated states (Sept 16 to Oct 31) to see if there were any similar changes at around the same points in time.
Data
Wisconsin (WI) Vs. Michigan (MI)
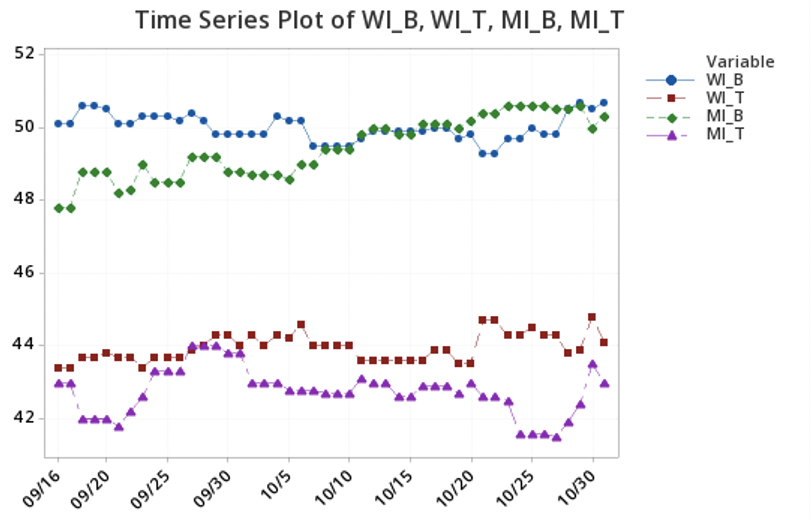 Figure 1: Wisconsin (WI) Vs. Michigan (MI). B=Biden, T=Trump.
Wisconsin (WI) Vs. Iowa (IA)
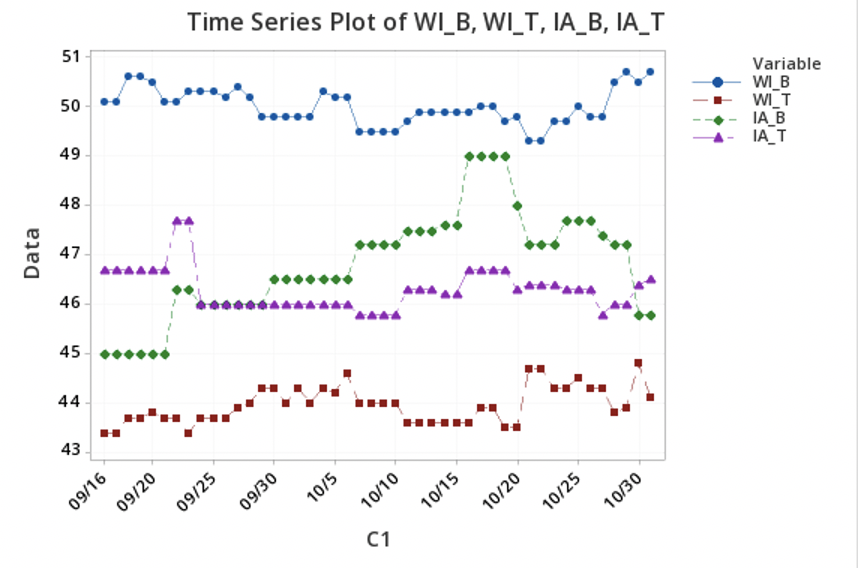 Figure 2: Wisconsin (WI) Vs. Iowa (IA). B=Biden, T=Trump.
Pennsylvania (PA) Vs. Michigan (MI)
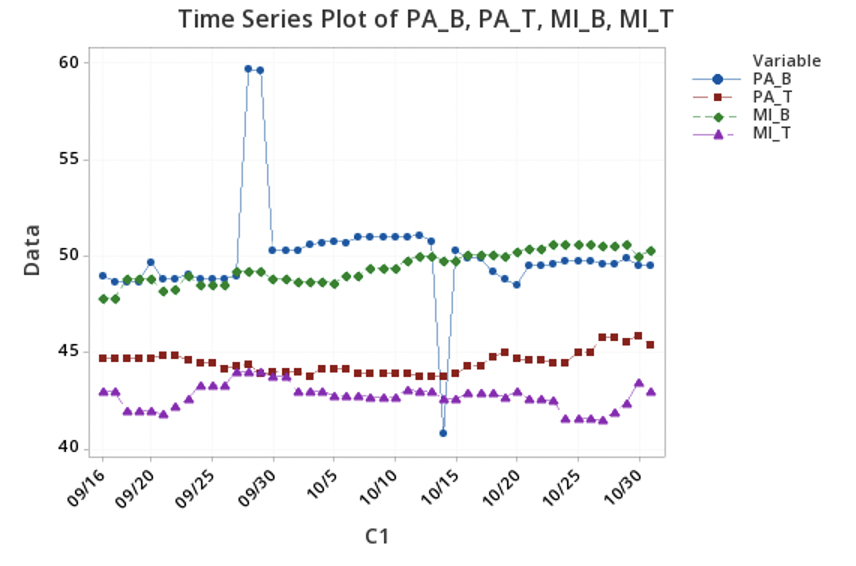 Figure 3: Pennsylvania (PA) Vs. Michigan (MI). B=Biden, T=Trump.
Michigan (MI) Vs. Ohio (OH)
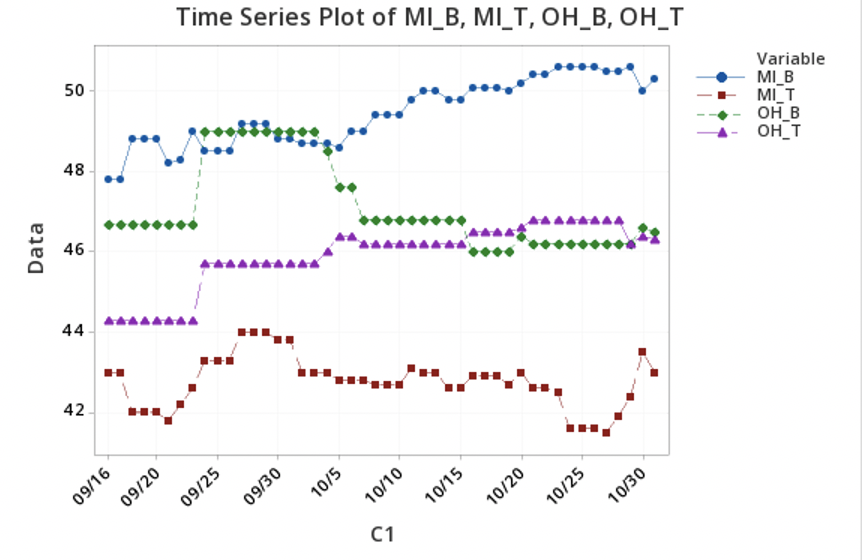 Figure 4: Michigan (MI) Vs. Ohio (OH). B=Biden, T=Trump.
Analysis
Wisconsin
Biden has maintained a clear lead in Wisconsin, exceeding a margin of ten points at moments. Recent polls have shown an increase in support for the Trump campaign and with it declining support for Biden, although Trump’s momentary jump in polling results around October 20 quickly regressed back towards the mean, suggesting his recent success is not meaningful. The data shown has had very few unanticipated and noteworthy variations, and both candidates are polling higher than they were in September.
Iowa
Since Iowa is closely similar to Wisconsin demographically, the assumption would be that they are also polling in a like manner. This is not exactly the case, however, as Iowa’s polling results have been much more chaotic and unpredictable, with each candidate’s resultus constantly fluctuating. Trump led up until around September 25, and has regained his lead in the last two days. Although Biden’s numbers have recently plunged, he is still polling higher than he was two months ago. The candidates have remained close throughout recent months, even to the point that their polling success’ have seemingly mimicked each other, which is bizarre considering candidates generally have inverse relationships with respect to polling success. Between October 16 and October 20, they each took significant jumps then rapidly fell at the precise same moments.
Pennsylvania
Much like Wisconsin, Biden has held a steady, unbroken lead for the past two months. Despite this, Trump’s polling statistics have steadily increased during that time period. Around October 28, Biden numbers dropped, accompanied by an unusually contrasting smooth increase for Trump, that has continued since. Biden quickly recovered and reclaimed the points he ceded, although he is yet to, and most likely will not, regain the impressive lead he held from October 5 to October 10.
Michigan
The trend in Trump’s votes have been considerably more tumultuous than Biden’s from September 20 to the present time. Votes for Biden fluctuated more often between September 20 and September 27, while Trump’s votes steadily curved, decreasing to increasing. One thing to note is the sudden decrease for Trump from October 24, followed by a sharp increase on October 30, while Biden’s votes have continued to steadily increase during that period of time.
Ohio
In the middle of September, both Biden and Trump experienced an increase in votes, an odd occurrence when votes for opposing candidates are usually inversely related. From October to the present time, Biden began to have a downward trend while Trump grew upwards. Near October 4, there was a small spike for Biden and Trump, albeit in opposite directions.
Conclusion
Although Michigan, Wisconsin and Ohio are correlated 0.95-1.0, as well as Iowa and Wisconsin, only Michigan and Wisconsin follow similar trends. Votes for Trump saw slight increases around September 27- October 4th. In the last couple of days, both Wisconsin and Michigan saw a slight decrease. Similarly in both states, when Biden sees an increase in one state, it is often mimicked in the next. Although Wisconsin and Iowa are demographically correlated, the recent polls show that the trends between each state are not similar. This means that the demographic correlation between states does not always mean that these states will follow similar voting patterns. The dissimilarity between the point changes in demographically similar states indicates that demographics alone does not determine the polling trends. We suggest also considering other variables, such as previous election results (both Presidential and Senate), voter turnout, as well as hot topics in the area.
References
https://www.statista.com/chart/22713/trump-biden-poll-demographics/ https://www.theatlantic.com/politics/archive/2019/10/swing-state-demographics-2020-presidential-election-the-politics-daily/600706/ https://www.statista.com/chart/22713/trump-biden-poll-demographics/ https://bipartisanpolicy.org/wp-content/uploads/2019/06/Two-Perspectives-on-Demographic-Changes-in-the-States-Ahead-of-the-2020-Presidential-Election.pdf https://www.governing.com/topics/urban/gov-majority-minority-populations-in-states.html https://www.history.com/news/swing-states-presidential-elections
