Good Polls and Bad Polls
Introduction
One of the decisions we had to make in developing our model was how to weigh polls and which polls to consider when calculating our prediction. On Nate Silver’s FiveThirtyEight website polls are ranked on an alphabetical scale based on a list of criteria including the poll’s methodology, sample size, and integrity. The FiveThirtyEight model includes plus and minus ratings for each letter grade, but for our purposes we are considering only the letter (eg. A+ and A- polls both count as A). For the original Oracle prediction we decided to include “A”, “B”, and “C” rated polls and only weigh them based on how long before the election they were conducted. When deciding on our methodology we ran tests to determine whether weighting the polls had an impact on the outcome of the model, and then voted as a class on whether to weigh polls by type (registered vs. likely voters) and sample size. We decided that the effects of weighing them would be insignificant, but didn’t consider whether weighing based on the letter ranking would have a significant effect on the model.
The majority of polls are conducted in battleground states, because these are the states that will determine the outcome of the election. States with close predictions might have dozens of polls whereas already decided states might have one or two. In order to increase the amount of data we were working with, our model includes “A”, “B”, and “C” results polls, sacrificing some of the accuracy for a larger sample size. In this blog post, we are exploring whether including only “A” and “B” rated polls or only “A” rated polls in our prediction would have a statistically significant effect on the prediction of our model.
Although non-battleground states may not have any polls, changing the polls we use will still affect the results of those states. Our model correlates state results with the demographics of the states, meaning if a state’s results change, other states which are demographically similar will also change.
Methodology
We started by collecting the polls we needed from FiveThirtyEight’s website. We then ran the ORACLE model twice, once using only “A” rated polls, and again using “A” and “B” rated polls. For each state, we found the difference between the regular ORACLE results, using “A”, “B”, and “C” rated polls, and our results with “A”, or “A” and “B” rated polls. Using the differences, we conducted matched-pair t-tests.
Results and Analysis:
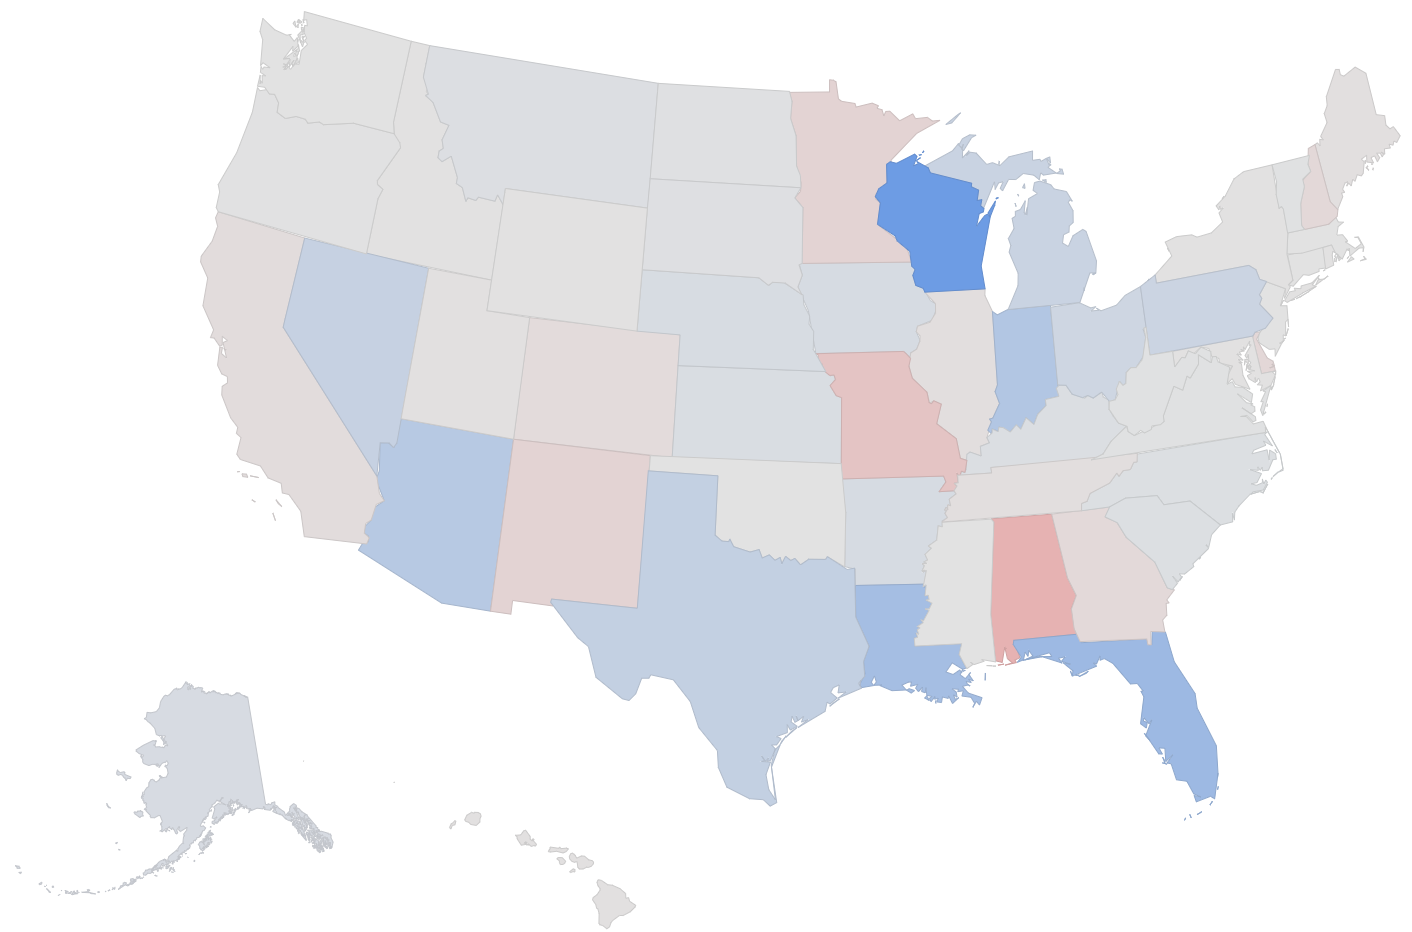
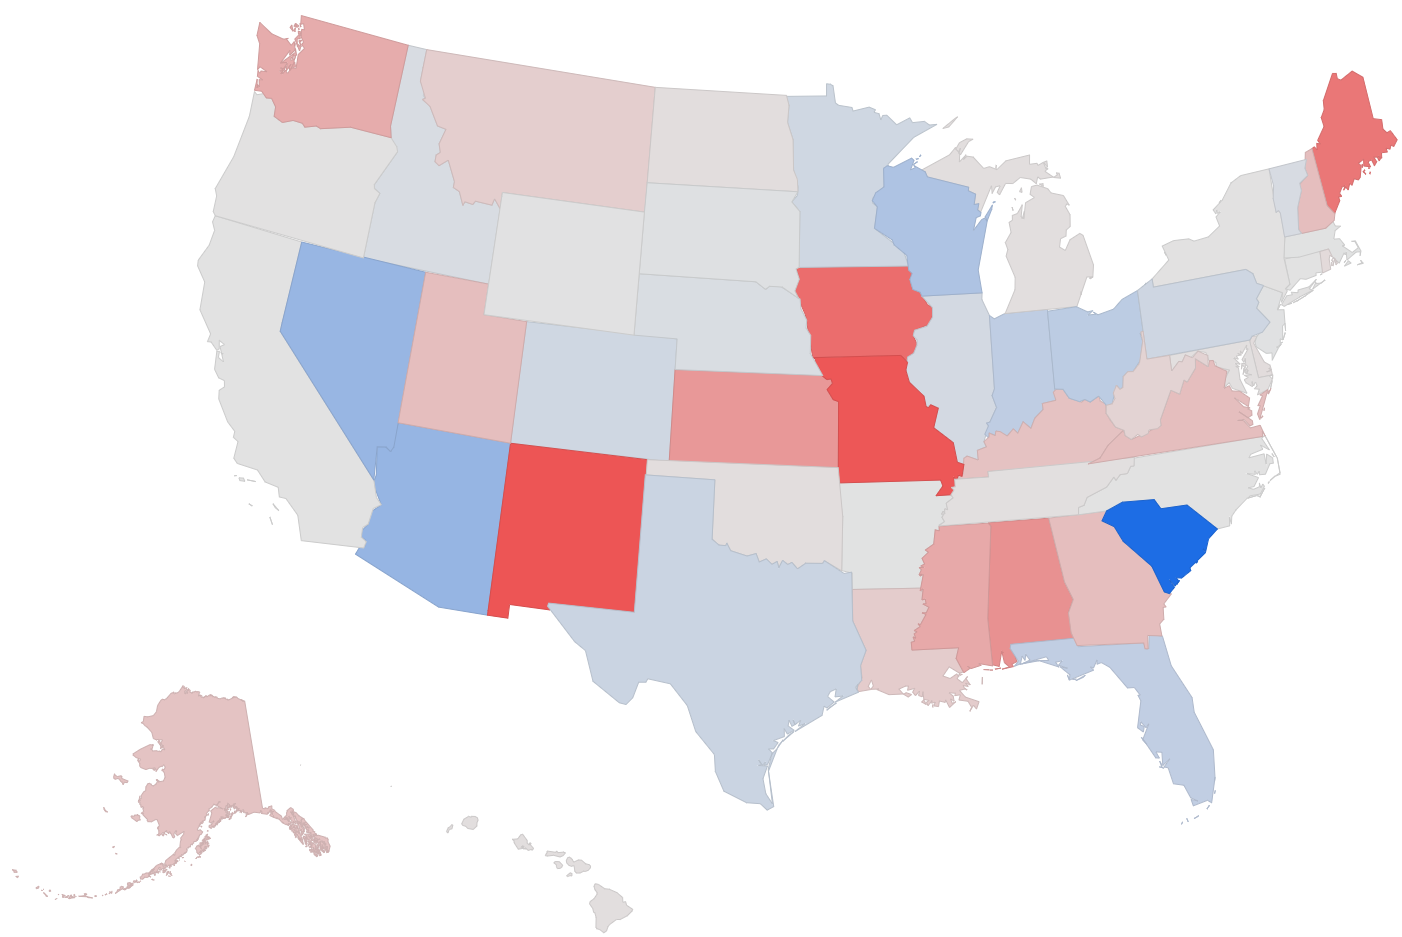
If the ORACLE model had used only “A” and “B” rated polls, each state’s predicted results, on average, would have shifted 0.59% in favor of Biden. The t-test of this difference resulted in a p-value of 0.0379, meaning there is only a 3.79% chance that this difference is due to random variation, and that this difference is statistically significant at a significance level of 0.05. If the ORACLE model had only used “A” rated polls, each state’s predicted results, on average, would have shifted 1.41% in favor of Trump. The t-test of this difference resulted in a p-value of 0.0486, meaning there is only a 4.86% chance that this difference is due to random variation, and that this difference is statistically significant at a significance level of 0.05. Overall, if we had used only “A” and “B” rated polls, our model’s results would have shifted towards Biden, and if we had used only “A” rated polls, our model’s results would have shifted even more strongly towards Trump.
The maps of the states display the percentage difference of each state’s results if the polls used were changed. If only “A” and “B” rated polls were used (Figure 1), a number of states, mostly battlegrounds, shift slightly towards Biden, as shown in the table below. The only state that was significantly affected was Wisconsin, with a much larger shift than any other state. The other standout result was Louisiana, a very solidly red state in the model which shifted blue. If only “A” rated polls were used (Figure 2), several states shift strongly red. The outlier in these results is South Carolina, a red-leaning battleground state which shifts towards Biden by more than 15 percent, more than any other state in both of our comparisons. Table 1 displays the full results of the standout states from each comparison, states whose results changed the most after either poll change.
| State | ORACLE Results | "A" & "B" Poll Difference | "A" Poll Difference |
|---|---|---|---|
| Florida | 57% to Biden | +5.27% to Biden | +2.54% to Biden |
| Louisiana | 96% to Trump | +5.66% to Biden | +2.05% to Trump |
| Wisconsin | 70% to Biden | +8.92% to Biden | +3.97% to Biden |
| South Carolina | 64% to Trump | +0.44% to Biden | +15.23% to Biden |
| New Mexico | 78% to Biden | +1.41% to Trump | +12.91% to Trump |
| Missouri | 73% to Trump | +2.74% to Trump | +12.75% to Trump |
Table 1: Notable state results after poll changes
 Figure 3: How only using “A” and “B” rated polls affected the ORACLE results for each state:
Blue means that results were shifted towards Biden, and red means that results were shifted towards Trump. The intensity of the color corresponds to the magnitude of the difference.
 Figure 4: How only using “A” rated polls affected the ORACLE results for each state:
Blue means that results were shifted towards Biden, and red means that results were shifted towards Trump. The intensity of the color corresponds to the magnitude of the difference.
References
Presidential general election polls [Table]. (n.d.). FiveThirtyEight. https://projects.fivethirtyeight.com/polls-page/president_polls.csv
Silver, N. (2014, September 25). How FiveThirtyEight Calculates Pollster Ratings. FiveThirtyEight. Retrieved October 26, 2020, from https://fivethirtyeight.com/features/how-fivethirtyeight-calculates-pollster-ratings/
ORACLE of Blair. (2020, October 19). [Blair High School 2020 Presidential Election Predictions]. Retrieved October 25, 2020 from https://polistat.mbhs.edu/
