What Happened to the Lone Star State?
In most people’s living memory, Texas has always been the same from election to election: a big pointy red thing at the base of the map. Many Americans may not even remember the last time Texas voted blue nearly 45 years ago, when Jimmy Carter edged out Gerald Ford in 1976. Since then, Texas has consistently remained a Republican stronghold, our own model pinning a partisan index of 7.2% on it (i.e. absent other factors, we’d predict a 57.2% vote for the Republican candidate). So it comes as a surprise this year that many political models — including our own — show Texas as a red-tinted swing state. What happened to Texas? Why has the most conspicuously red state in the country turned gray?
The Hispanic Vote
The first explanation often tossed around is that the growth of a liberal Hispanic demographic in Texas coming from its status as a border state has led to a sizable increase in liberal voters.
This probably doesn’t represent that big of a change in the last 4 years, as the Hispanic population hasn’t changed much since 2016. The percentage of Texas’ population that was Hispanic in 2016 was 39.1%, while (extrapolating from survey data from 2016-2019) we expect the Hispanic population to be around 39.95% in 2020. It is impossible for such a small change in one demographic to cause as large of a swing as we are predicting in Texas.
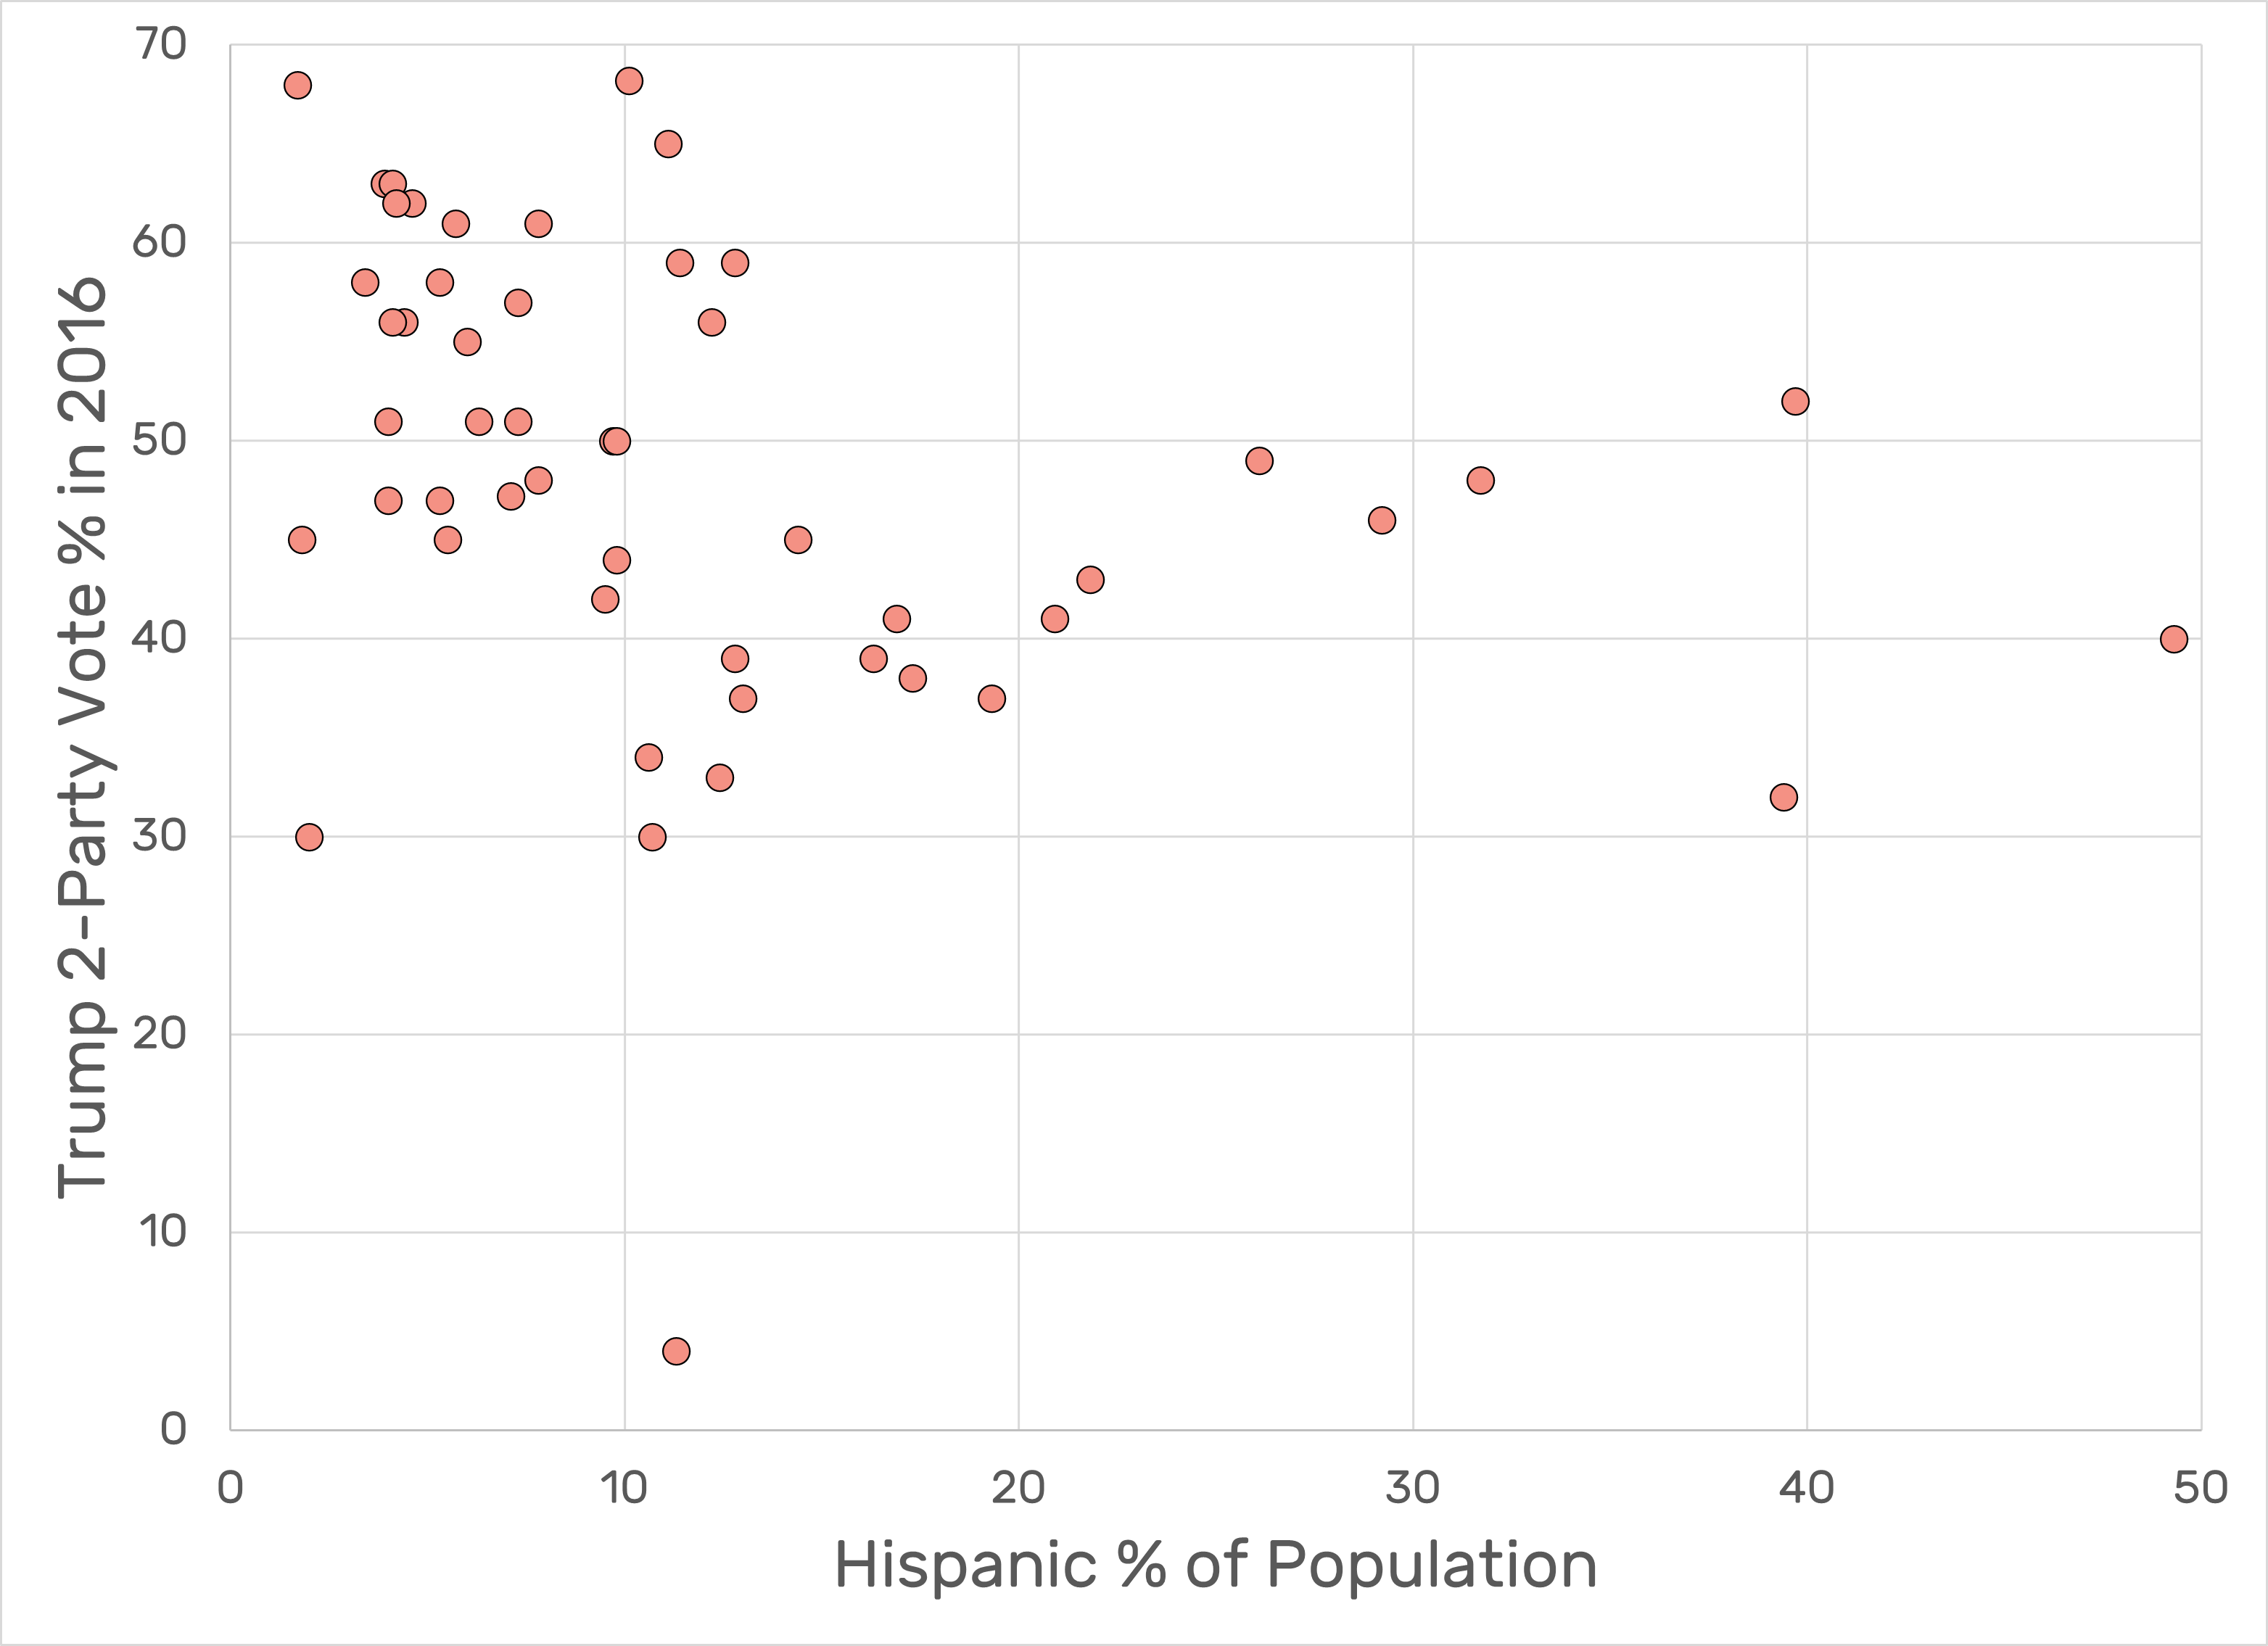
This change is even less likely to explain Trump’s disappointing performance in Texas in our model, as large Hispanic populations haven’t correlated strongly with states leaning one way or another in past elections.
 In 2016, the percentage of the state population that was Hispanic explained only 9.71% of the variation in the Republican vote across states, as opposed to 21.78% for the White population and a mere 3.92% for the Black population. In other words, the amount of the vote that Trump received from a state in 2016 wasn’t really related to the size of the Hispanic population in that state.
Putting both of these pieces of evidence together, we see that the Hispanic population in Texas hasn’t grown that much since 2016, and the amount it did grow shouldn’t greatly affect which way the state leans. The growth of Hispanic populations has probably contributed slightly to Texas turning bluer this year, but it’s not the primary reason for the shift.
Growth of Urban Centers
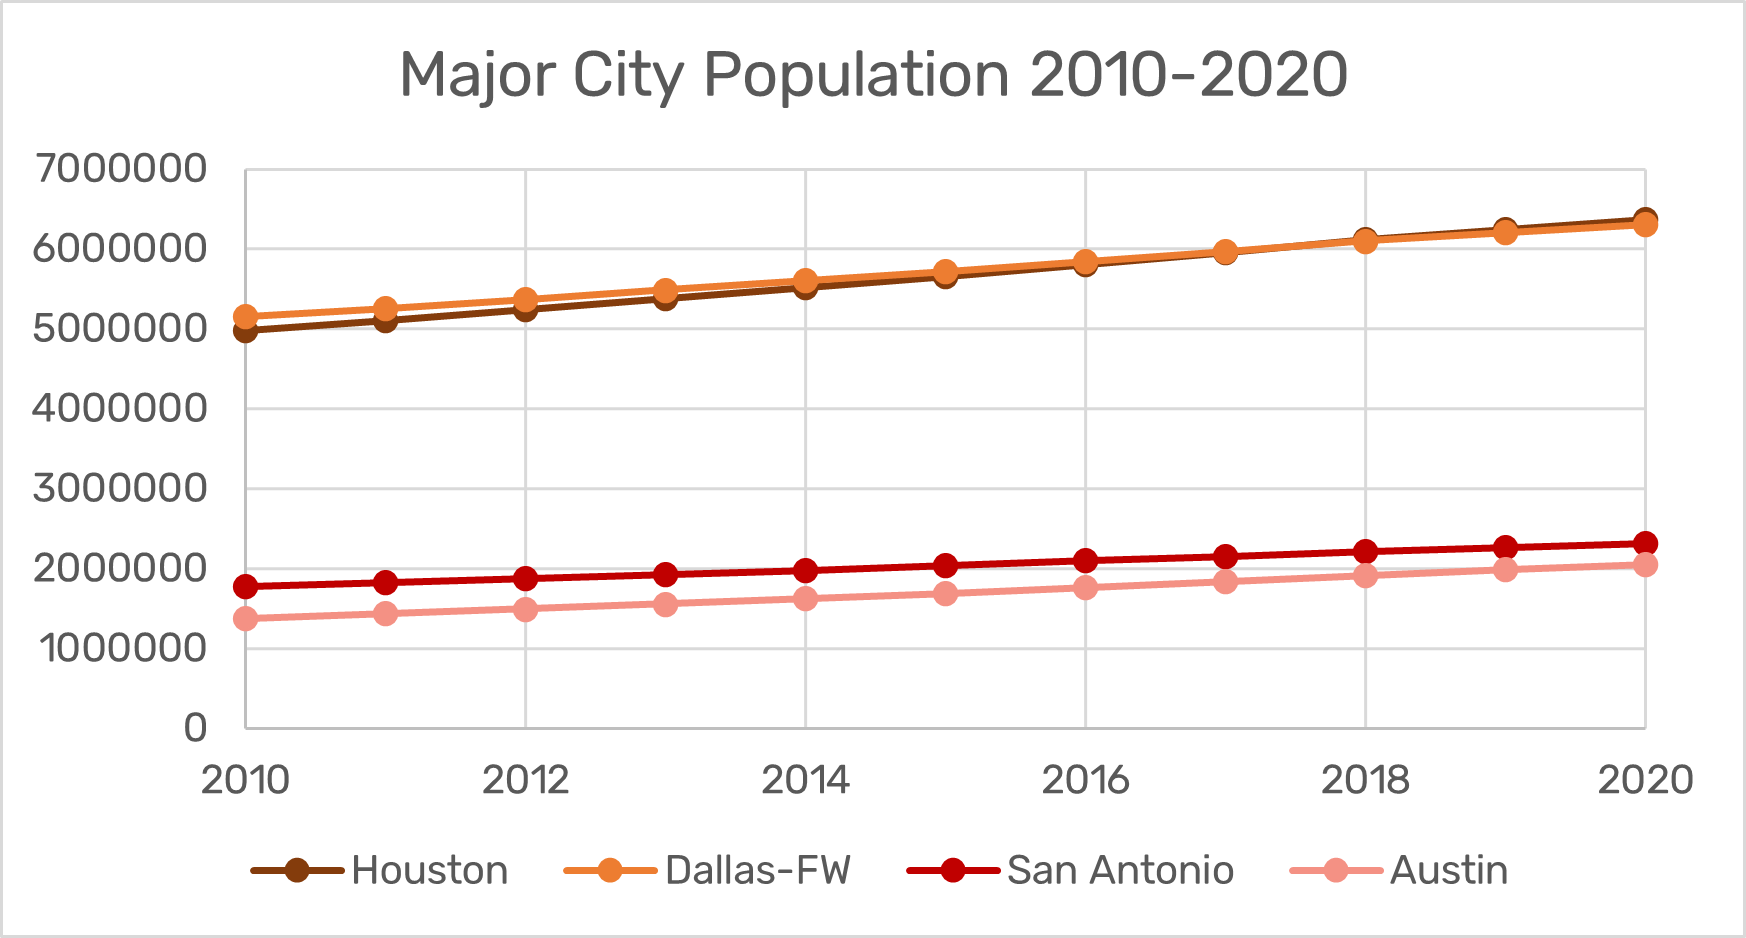
Another possible explanation is that over the years, as Texas’ population has skyrocketed and urban centers have grown, so too has the percentage of Texans leaning left. It’s no secret that urban areas tend to have higher percentages of Democrats, as opposed to rural areas that skew very Republican, so a growth in the urban percentage could explain the shift.
In 2016, Texas had a population of 27.91 million. Just four years later in 2020, it’s estimated that Texas has grown by two million people to reach a population of 29.9 million. Much of that growth has been from major cities and urban centers, while rural areas have lagged behind, making Texas’ population increasingly concentrated in a handful of metropolitan areas. In fact, the urban share of the population of Texas has grown from 79.6% in 1980 all the way to 85.7% in 2010. And it’s still growing. Urban areas in Texas are expected to account for over 90% of the total population growth from 2010-2050.
 According to the Pew Research Center, in 2017, urban counties leaned 31% Republican and 62% Democratic while rural counties leaned 54% Republican and 38% Democratic. Suburban areas fell right in the middle, leaning 47% Republican and 45% Democratic. However, as large as this advantage may seem, it hasn’t come out of nowhere. As far back as 1980 and beyond, nearly 80% of Texas’ population have lived in urban or suburban areas, and those areas have continued to grow steadily. Despite this, no Democratic presidential candidate has won Texas since the days of Jimmy Carter. The margins of victory aren’t narrow, either. Donald Trump won by 9 points in 2016. Mitt Romney won by 16 points in 2012. The rate of urban expansion in Texas remains the same as it has been for at least the last ten years, so there is no reason to believe it could suddenly swing the state after Democrats have lost so many previous elections by such wide margins.
Yes, Texas’ demographics have changed. Yes, urban centers have grown. But their growth isn’t any greater than four years ago, or eight years ago, when Republicans won by high margins. While it may have helped lay some groundwork, urban growth alone is not enough to push Texas far enough to become the toss-up we predict it to be.

Trump's General Underperformance
Our final possible explanation for Texas’ 2020 swing towards blue is that it’s just a conspicuous local case of a greater national blue swing this year. Polls have been indicating for months that Biden has a lead over Trump, and it’s not hard to see why, given the inordinate amount of controversies that have plagued his presidency including his handling of the COVID-19 pandemic, and his own recent health developments. We decided to see how his across-the-board drop in popularity matches up with Texas’ changes.
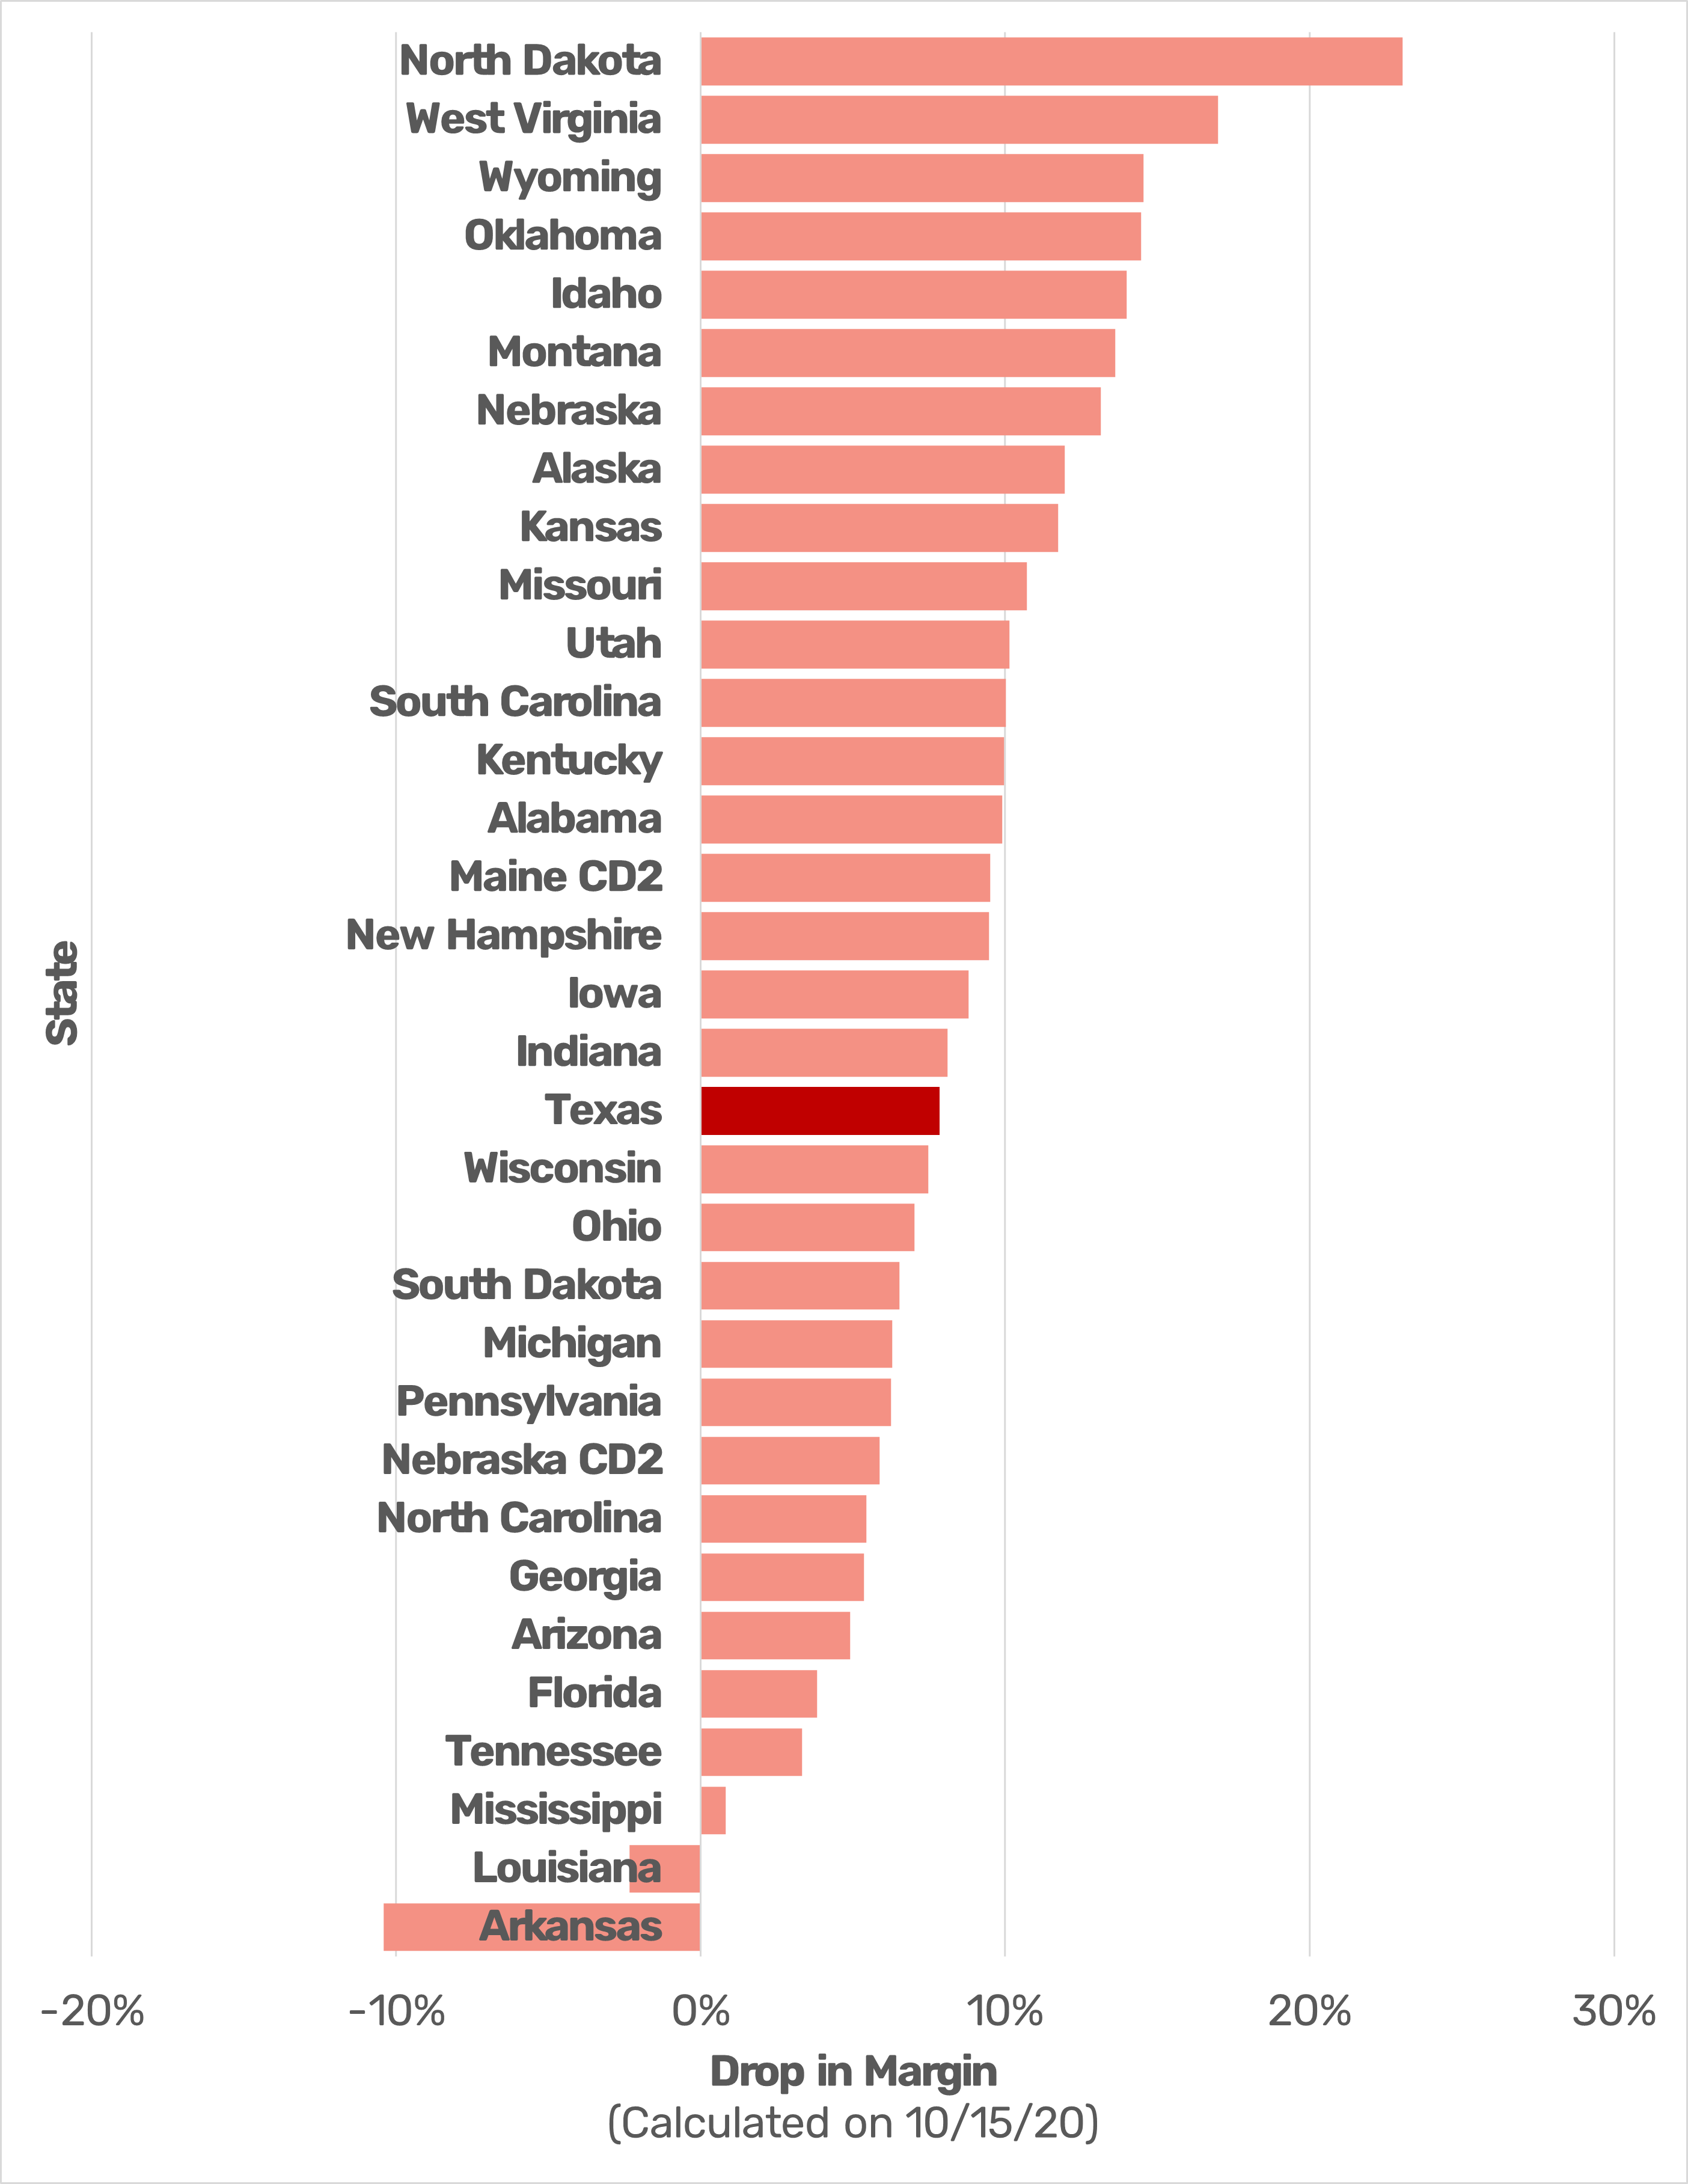
To do this, we examined every state Trump carried in the 2016 election, and calculated Trump’s final 2-party vote margin over Clinton. 2-party votes are necessary to calculate when third-party candidates are involved, as they were in 2016, and represent the percentage of votes for either major party the candidate garnered, guaranteeing that the two major party candidates’ votes will sum to 100%. We then calculated Trump’s predicted margin over Biden in those states, and subtracted the 2020 value from the 2016 value to find the drop in margin, to be used as a measure of underperformance relative to the previous election. The values tell quite a story.

Aside from Louisiana and a startling outlier in Arkansas, Trump is doing measurably worse in every state he carried in 2016. Leaving aside a few outliers, most of the states fall into a smooth cluster of 5-15% drop in margin. Sitting right in the middle of that cluster is Texas, with its drop of 7.86%, a tiny -0.098 standard deviations away from the mean of 8.44%. Texas isn’t anything special after all: its shift to gray since 2016 is right in line with shifts in other previously red states.
Conclusion
Texas’ shift is mostly due to Trump’s overall weaknesses as a candidate, with only a slight assist from a growing urban and Hispanic population. If its changes aren’t anything out of the ordinary for how this election is going, though, then why did it stand out so much in the first place? States like North Dakota ought to be far more shocking, carrying a partisan index more than twice Texas’ and a drop in margin nearly three times as large.
North Dakota doesn’t hit as hard for a few reasons. For one, despite its massive drop in margin, it remains safely Republican for this election, whereas Texas has visibly turned gray. But also, few states dominate the map like Texas does: it’s the second largest and second most populous state in the entire nation, carrying 38 electoral votes (compared to North Dakota’s 3). It’s an electorally critical state, and Republicans have relied on it as part of their base for decades, making its spot on the battleground list a significant indicator of a big shift in national mood for this election.
Texas seems to be experiencing a blue spike, owing mainly to Trump being an overall weak candidate, rather than any underlying changes to the population. While the result is shocking and could be highly consequential in this election (ORACLE predicts a 1.6% chance of a Trump victory if Biden takes Texas), it probably won’t last. Texas’ demographic makeup is trending toward blue, but the progress is slow. If Republicans field a stronger candidate in the next election, we’re likely to see Texas return to what it’s been for the last 45 years: a bastion of the Republican electorate.
References
Hispanic Heritage Month 2017. (2018, August 03). Retrieved October 29, 2020, from https://www.census.gov/newsroom/facts-for-features/2017/hispanic-heritage.html
Horowitz, J. M., Parker, K., Brown, A., Fry, R., Cohn, D., & Igielnik, R. (2020, May 30). 2. Urban, suburban and rural residents’ views on key social and political issues. Retrieved October 29, 2020, from https://www.pewsocialtrends.org/2018/05/22/urban-suburban-and-rural-residents-views-on-key-social-and-political-issues/
Presidential Election Results. (n.d.). Retrieved October 29, 2020, from https://www.sos.state.tx.us/elections/historical/presidential.shtml
Turnout and Voter Registration Figures (1970-current). (2020). Retrieved October 29, 2020, from https://www.sos.state.tx.us/elections/historical/70-92.shtml
U.S. Census Bureau QuickFacts: Texas. (2019, July 1). Retrieved October 29, 2020, from https://www.census.gov/quickfacts/TX
White, S., Potter, L. B., Valencia, L., Jordan, J. A., Pecotte, B., & Robinson, S. (2017, August). Urban Texas. Retrieved October 29, 2020, from https://demographics.texas.gov/Resources/publications/2017/2017_08_21_UrbanTexas.pdf
You, H., & Potter, L. (2018, June). Estimates of the Total Populations of Counties and Places in Texas for July 1, 2016 and January 1, 2017. Retrieved October 29, 2020, from https://demographics.texas.gov/Resources/TPEPP/Estimates/2016/2016_txpopest_place.pdf
