Obama vs. Trump Approval Ratings
The upcoming 2020 election is not Donald Trump’s first go-around which means the current president of the United States probably has what is known as incumbency advantage. The term refers to the benefits and advantages that the current office-holder has when running for reelection. Whether it be more name recognition, easier access to campaign finance, casework, or redistricting in his or her favor, there are many advantages to being an incumbent that could potentially have huge impacts on the next election. Donald Trump is banking on this advantage looking towards the upcoming election so, at the Oracle, we decided to test how his current approval ratings stacked up against those of an incumbent from the past to see how it may impact his chances in 2020.
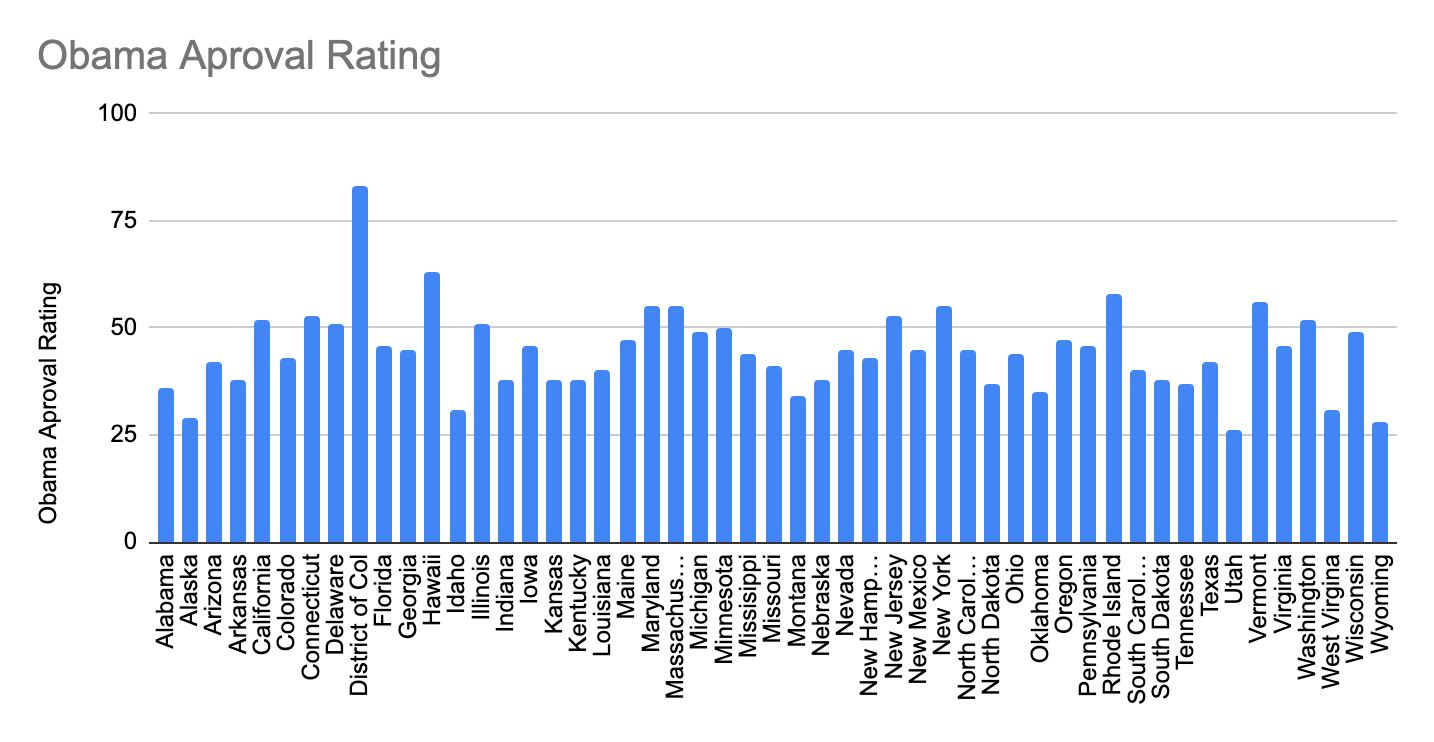
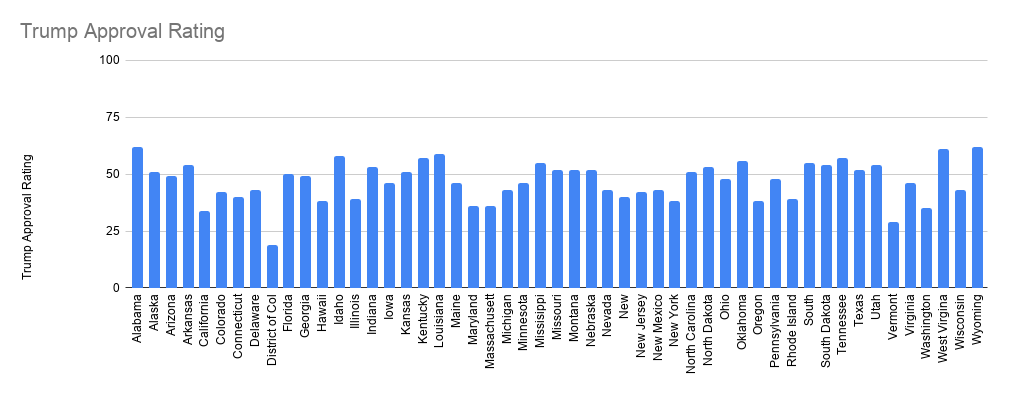
At the end of his first term, Barack Obama had an average approval rating of 53% compared to the current incumbent’s rating of only 41%. Trump’s disapproval rating is also almost 10 points higher than Obama’s was at around the same time in 2012 which begs the question of whether his incumbency may not actually help him after all
To test this, The Oracle of Blair compared Obama’s approval ratings by state in 2012 to Trump’s approval rating by state in 2020. We started by finding a relationship between Obama’s approval rating from each state and the percent of the two-party vote he received in that state in the 2012 election. We found his approval rating in each state in June 2012 and ran a regression model to find an equation.
 The equation we got was two-party percentage of incumbent = -0.0239 + 0.011752(Approval rating). Next, we got Trump’s approval rating in each state from February 2020 and plugged them into our equation.
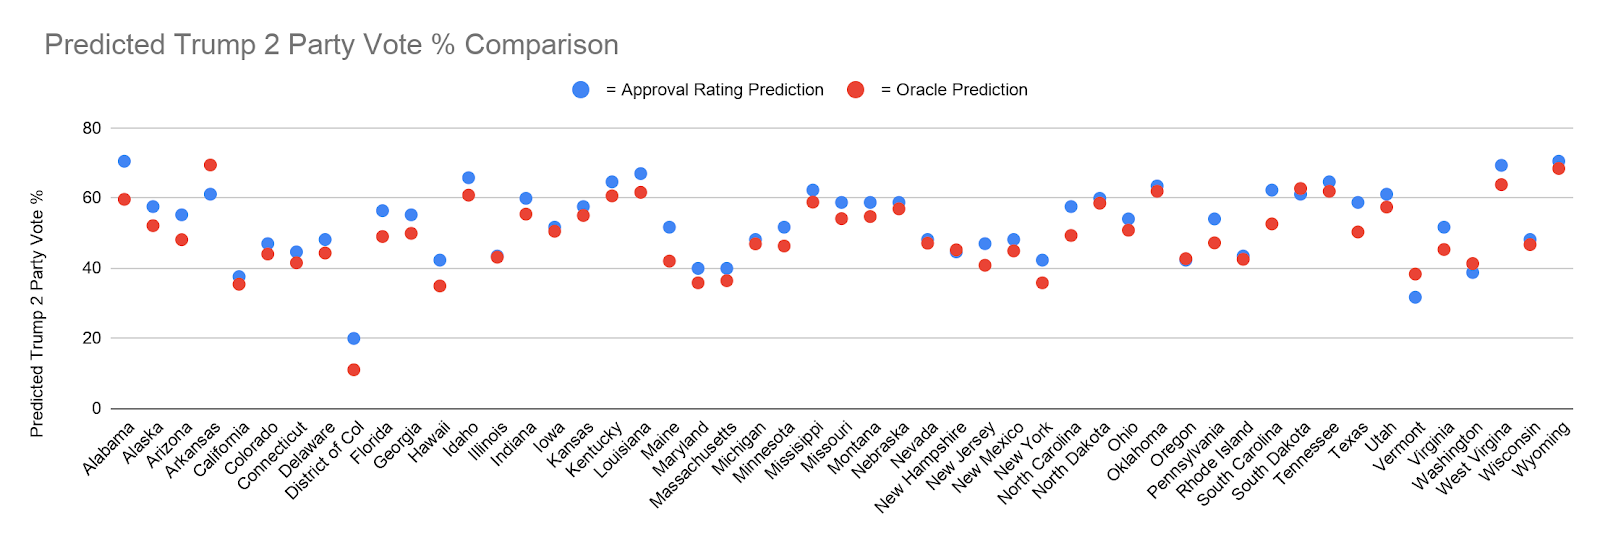
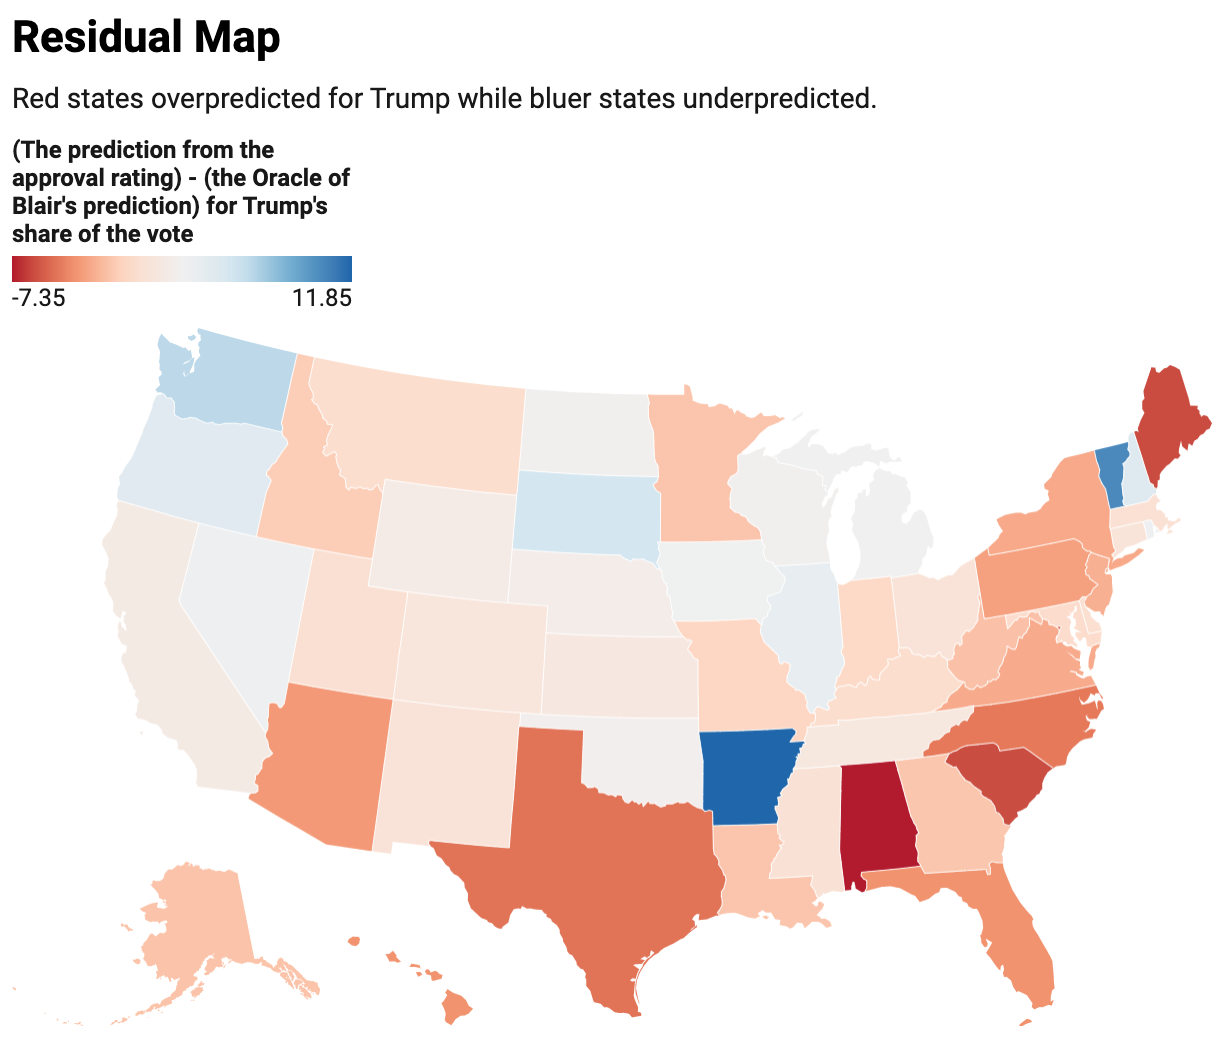
 These results now gave a prediction of Trump’s vote in each state based solely on his approval rating. Finally, to see how good of a predictor an incumbent president’s approval rating is, we compared our predicted Trump 2-party vote percentages with the percentage predicted by the Oracle. To compare them we found the squared error for each state, or (our prediction - the oracle’s prediction)2. Finally, we averaged the squared error from each state and took the square root of that to find the root mean squared error which was 5.168%.


Presidential approval ratings didn’t make it into the Oracle of Blair, and other models, for many reasons: inavailability, infrequent collection, and the incomplete picture they paint. However, approval ratings told a fairly accurate story in 2012, accounting for over 92.5% of the variance in the two party vote and 93.4% of the variation in the overall vote. Therein lies a big problem with predictions from approval ratings. Two party vote is inaccurate, and the overall vote won’t reveal whether the incumbent wins that state or not because only a plurality is needed. Using the two-party vote, Trump wins 273 electoral votes—a very slim margin—even when you apply his 2 point rating drop to every state. While that outcome is possible, the Oracle predicts Trump winning under 200 electors.
Before we talk about the problems with modeling an election using solely approval ratings, there are problems with the data that need to be addressed. Approval ratings are generally collected on the national level because the statewide expense is thought to be better used on other types of polling, so we relied on one poll each for Trump and Obama. Morning Consult has a B/C pollster rating with a slight democratic lean. Obama’s approval ratings were compiled by Statista. Since the data was collected in January, Trump got acquitted, the new Russia report, Covid-19 and the lockdowns and economic downturn all happened. Trump’s approval rating has dropped 2 points since then, and we applied a 2 point drop in every state, but that probably didn’t accurately reflect the changes in each state because they likely varied due to covid severity and other factors.
There’s also the difference between when the data was collected. Trump’s data was from January when the primary season is still happening meaning most campaigns were focused on winning their party’s nomination. Obama’s data was collected in June when it’s pretty clear who the candidates from the two major parties will be, and campaigning is focused on winning the election and beating the other party’s candidate. Approval ratings also don’t take into account whether someone will vote, but in 2016, likely voters polls did not do much better than other polls like registered voter polls and adult polls.
If the Oracle’s predictions are right, Trump’s approval rating model is not telling the right story. Trump is currently polling worse than any modern presidential incumbent, and the Oracle of Blair also predicts Biden will win. On their own, presidential approval ratings have not proven to be perfect predictors, but if they were more frequently collected and worked in tandem with other predictors, they might be helpful in future modeling.
References
- https://news.gallup.com/poll/116479/barack-obama-presidential-job-approval.aspx
- https://www.newsweek.com/trump-disapproval-rating-10-points-higher-obama-october-2012-1539675
- https://www.statista.com/statistics/238036/obama-job-approval-rating-by-us-state
- https://morningconsult.com/tracking-trump-2/
- https://projects.fivethirtyeight.com/pollster-ratings/
