Oracle vs. FiveThirtyEight in the Midwest
Introduction
The Oracle predicts similarly to FiveThirtyEight’s model in the Midwest, a region full of battleground states. However, there are some slight differences in the timelines and predictions. Here, we will try to explain these discrepancies using 2 key differences in our methodologies.
Discussion
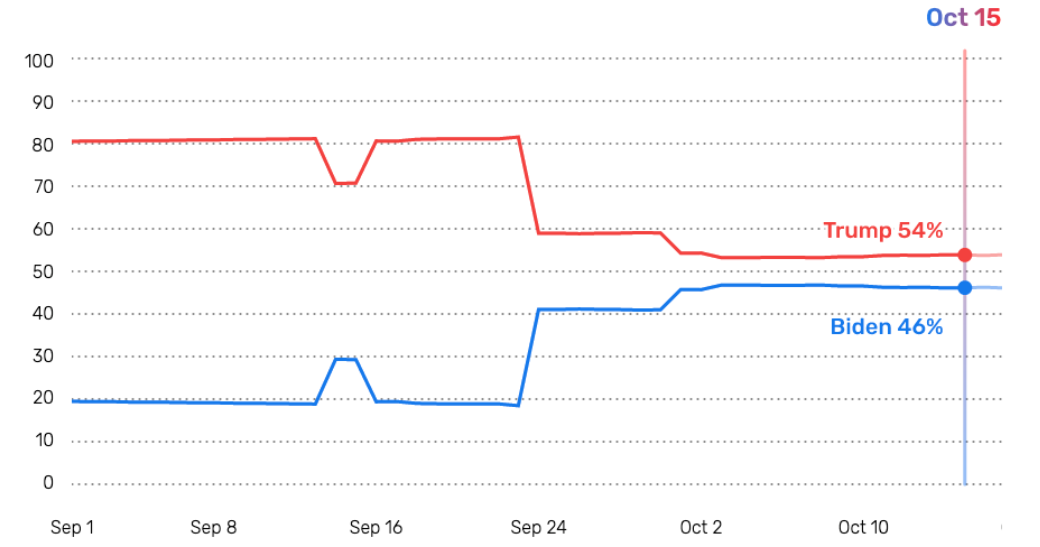
The Oracle uses a novel z-test method. This is a line sweep method that checks if older polls are still relevant. By checking if there is a significant difference between certain blocks of time, the Oracle can decide whether a block of time is no longer relevant, or that the voter split has changed whether from a debate, major event, or anything. Rather than using continuous weights to factor in the relevance of polls, the z-test method completely disregards older polls that are deemed irrelevant. This causes sharp jumps in the timeline of the Oracle’s win probabilities. For example, between September 23 and September 24th in Iowa, Trump’s win percentage dropped 23 points, from 82% to 59%.

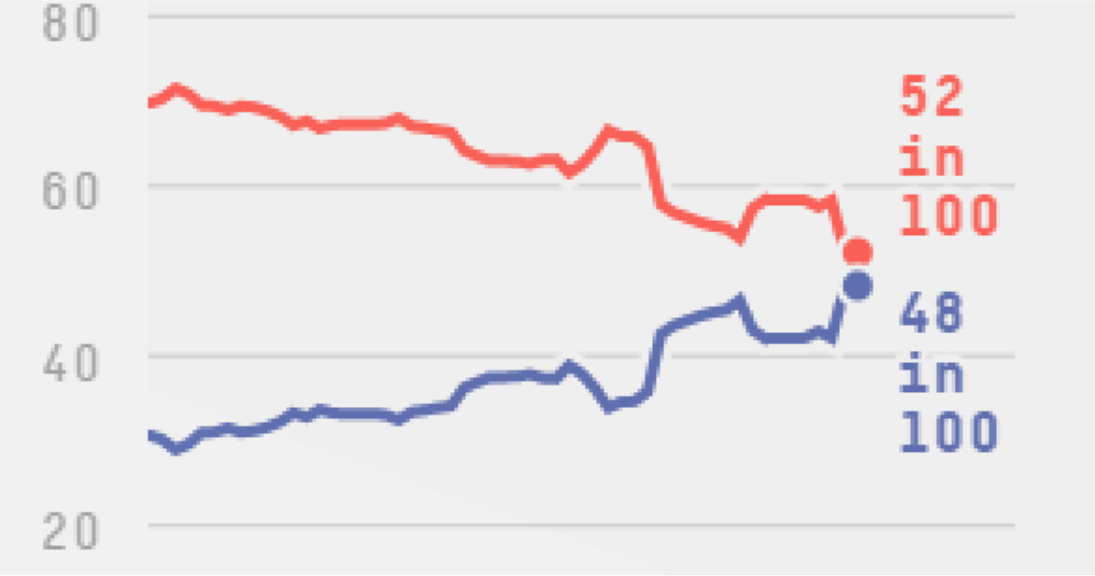
This was due to a set of polls being deemed no longer representative of the nation’s voting probabilities. In contrast, FiveThirtyEight has no such method of discarding older polls. Instead, they utilize a timeline adjustment that “adjusts ‘old’ polls for shifts in the overall race since it was conducted.” Their adjustment is also more smooth than that of the Oracle’s, leading to more continuous graphs. For comparison’s sake, below is the FiveThirtyEight’s timescale of win probability in Iowa:
 Although there are still small jumps in win probability corresponding to new polls being added, the Oracle “jumps” are much more improbable. In real life, people’s attitudes about candidates and who they will vote for shift roughly continuously over time, and certainly not in chunks of 20%. Although the intention of the z-test model was to only include polls significant to the current political climate, these spikes that it caused made it very difficult to compare to the FiveThirtyEight model, which uses a rolling poll average and thus appears to be much more continuous over time.
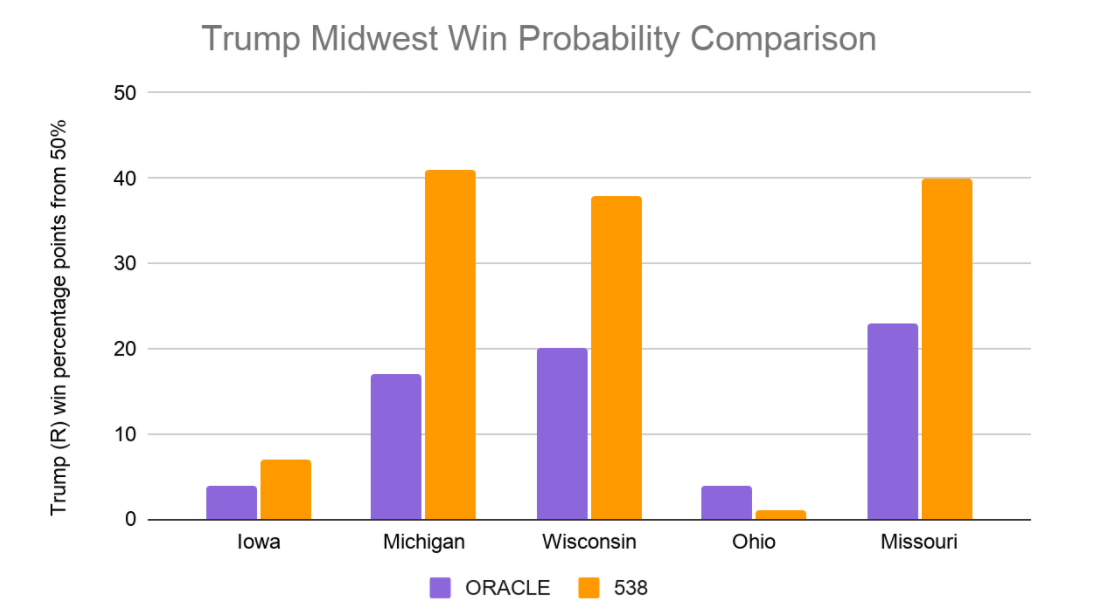
FiveThirtyEight’s model also factors in significantly less variance than the Oracle. This difference is clearly apparent in the predictions for vote percentage and win probability. For example, we can take the predictions on October 15th in the Midwest as an example (predictions have not changed much so it’s still pretty representative of more recent dates). As seen in the bar graph, FiveThirtyEight’s predicted win probability for Trump is much more extreme in both ways in states like Missouri and Michigan. The Oracle’s predictions are less confident in a victory or loss for Trump (closer to 50%), reflecting the gap in variance in the models. While Ohio does not follow this trend of win probability, this does not reflect a deviation from the trend in variance. Since FiveThirtyEight predicts a 49.9% vote share, it guarantees a nearly 50% win probability as long as the variance is larger than about 3%. Although FiveThirtyEight does not release the specific formulas they do for computing variance in the priors and poll averages, we suspect this gap is due to FiveThirtyEight’s formulas assigning lower variance to these quantities than our formulas do.

The Oracle’s high variance is based on the belief that this election in particular has increased instability due to the pandemic and limited access to voting, though polling data has shown unprecedented stability. Only time will tell which method proves to be more accurate. With the Oracle having less confidence in its predictions, it gives Trump a greater chance to capture electoral votes in Midwest battleground states than 538, potentially translating to a greater chance at the national level. However, this post only looks at a few states in one region, potentially with high covariance between the similar states. Check out a similar blog post about the Sun Belt states to see how Oracle compares to 538 in a different region.
References
Silver, N. (2020, October 26). 2020 Election Forecast. Retrieved October 26, 2020, from https://projects.fivethirtyeight.com/2020-election-forecast/
ORACLE of Blair. (2020). Retrieved October 26, 2020, from https://polistat.mbhs.edu/
