Oracle vs. FiveThirtyEight and The Economist in Sunbelt Swing States
Many large political magazines and publications will publish their predictions, each with their election models, methods, and outcomes. We believe it is important to compare our model to the models made by professional political writers to gain a better understanding of how different methodologies can give us different predictions. Specifically, we chose to compare our predictions of the competitive Sunbelt states to those of the models of 538 and The Economist.
538’s model and the Oracle of Blair have the same basic methods for making their prediction. They both use a calculated partisan lean (BPI for the Oracle), and demographics for each state as part of their priors, which are then combined with poll averages to create the final prediction. When formulating the priors for each state, 538 includes more factors than the Oracle. In addition to factoring in demographics to the partisan lean, 538 combines the partisan lean with where the race stands nationally, and correlates partisan lean based on each state’s region (Northeast, Midwest, South, or West), although this method is weighted the least out of the three parts. Another difference between the two models is how demographics are used. For the Oracle, the demographics of each state shift its BPI based on voting history in past elections. The 538 model, on the other hand, uses demographics to shift the partisan lean based on current polling in demographically similar states. Out of the demographics chosen, both models take into account race, education, religion, and urbanization, but 538 also includes income and COVID-19 severity. Mail-in voting is another factor considered by 538 and not the Oracle. Once the initial prior prediction is completed, 538 also takes into account an economic index, which makes up 5% of the final prediction for each state.
Once the prior prediction has been established, each state’s polls are averaged to get the final prediction. Since the Oracle used the same polls as 538, the main differences between their poll averages would come from their poll weighting schemes. The 538 model weights polls based on their poll grade, unlike our model, and we only use polls grade C or higher. 538 also takes into account likely voters versus registered voters polls, while we found there to be little difference between the two. When combining poll averages with the priors, in swing states such as the ones covered here, both models gave polls a relatively high 85% to 95% of the weight in the overall prediction.


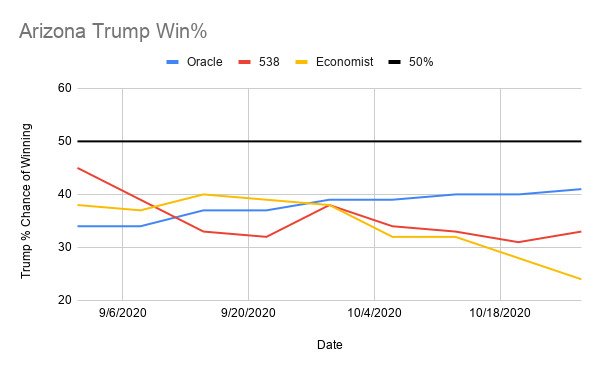
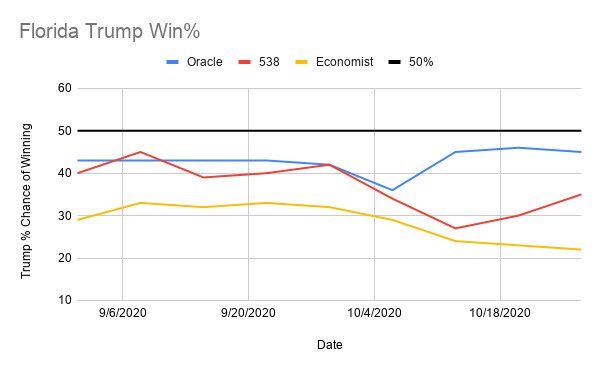
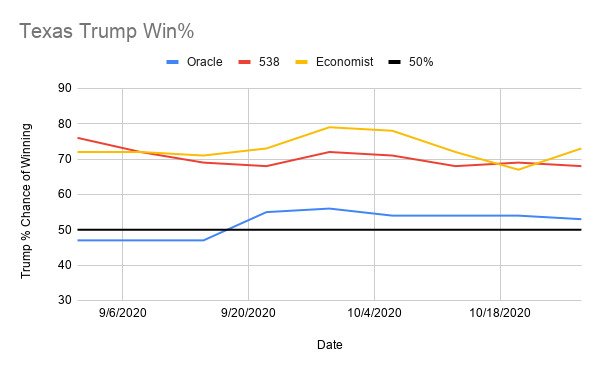
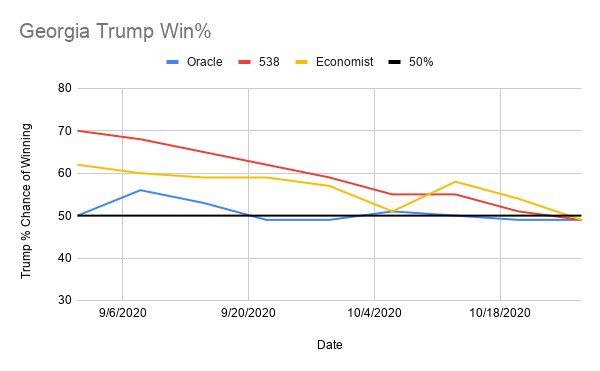
The 538 model predicts Trump having a higher chance of winning Texas than our model, while the Oracle predicts Trump with a higher chance of winning Florida and Arizona. Both models predict similar odds for Georgia. As of 10/28, Trump was given a 66% chance of winning Texas in 538’s model and a 51% chance in our model. The difference between these two odds must have resulted from a difference in priors since polling averages and weighting were very similar across both models in Texas. Since 538 takes into account region and demographically similar states into its partisan lean calculations, its priors would be more similar to other Southern, more red-leaning states. In Arizona, the Oracle gave Trump a 41% chance of winning, while 538 gave him a 30%. Similarly to Texas, the poll averages and weighting were almost identical in 538 and the Oracle for Arizona. One possible factor leading to the difference in priors in Arizona would be its COVID-19 history, taken into account by 538. Since Arizona was affected similarly to a state like New York, their predictions would be connected more strongly in 538 than the Oracle, giving Biden a slightly bigger advantage in Arizona in 538’s model. In Florida, 538’s polling averages had a significant difference from the Oracle’s averages, with the Oracle having Trump at -3.3 and 538 with -2.3. Despite this difference, Trump was favored much more in the Oracle’s overall prediction, showing the Oracle’s priors favored Trump drastically more than 538’s priors. One of the reasons this could have occurred is that 538’s weighting of Florida polls is much higher than its poll weighting for almost any other state. Also, the Oracle’s priors are impacted much more by election history, so Trump’s Florida win in 2016 could have pushed the current prediction closer to his side.
The Economist’s election model predicts Trump having a higher chance of winning Georgia and Texas while giving Biden a higher chance in Georgia and Florida. Much like the Oracle and 538, The Economist calculates a partisan lean for each state, similarly to our BPI. However, their model only takes into consideration the last 2 presidential elections whereas we include the vote share of midterm house elections. In Texas, where Democrats managed to turn 2 house seats and increase the democratic vote share by 9.9%, our model should give Trump a smaller chance of winning than The Economist, since we would give him a lower prior prediction. Our model gives Trump a 53% chance while The Economist gives him a 76% chance. However, this does not hold true in Arizona, Florida, or Georgia, in which a blue shift in 2018 does not correspond with a higher predicted chance for Biden in our model. (It is important to note that in FL, AZ, and GA, our model predicts Biden as having a very similar percentage of the votes, despite having a smaller chance of winning than in The Economist’s model.) The Economist also takes more economic factors into account than the Oracle while the Oracle focuses on demographic data to make a prior prediction. However, it’s hard to see how these differences affect the models due to increased polarization, less swing votes, and the generally unprecedented circumstances–both economically and socially–surrounding this election.

Another difference between the Oracle and The Economist’s model is The Economist’s decision to weight polls based on partisan non-response bias (correcting for when recent events make respondents less likely to admit to supporting a candidate even though their intentions are the same). The Economist claims that this weighting will limit the impact of conventions and scandals. However, in the week following the first presidential debate, we saw a similar shift in both The Economist and the Oracle even though The Economist’s prediction claims to take into account such events. However, this shift doesn't appear in AZ, FL, or TX, and the Georgia race is so close in both predictions that this shift could have just been due to natural variation and not partisan non-response bias.

Within these states, the Oracle tends to predict a similar popular vote but gives a very different prediction of the Candidates’ chances of winning. This indicates that our model has much higher levels of uncertainty than 538’s and The Economist’s models. This is due to the way we treated the polarization in the electorate and the Covid-19 pandemic. Both 538 and The Economist take into account the fact that the electorate has become much more polarized in recent years and have made adjustments such as the aforementioned partisan non-response bias, which would decrease the amount of variance and uncertainty in their predictions. 538 also includes Covid-19 rates as a correlating factor in states, which can also provide more certainty. The Economist takes into account Covid-19’s impact on the economy but treats the recession as if it is only 40% worse than the 2008 recession when it is 2 to 3 times worse, potentially decreasing the uncertainty the recession has in their model. Since we take no extra measures for these factors, the Oracle has a much higher uncertainty and therefore will predict the chance of a candidate winning to be closer to 50% while predicting a similar percentage of votes compared to the other models for that candidate.
It can now be seen that all three models have certain aspects in common, mostly with similar basic methods that differ in the ways that they are calculated. For example, all models use demographics and past election results to calculate a partisan lean for each state, but what is used to calculate the lean is different for each model. 538 uses more demographics than the Oracle and a regional correlation method; The Economist only takes into account the previous two presidential elections while the Oracle uses midterms as well. The Economist also weights polls based on partisan response bias, something which neither 538 or the Oracle takes into account. One major difference between the Oracle and the two professional models is that the Oracle doesn’t account for major events like debates and conventions while both 538 and Economist have their methods for accounting for shifts in opinion following said events.
Regarding the predictions themselves, 538 and Economist appear to have similar predictions in all four states as election day nears, with the Oracle having varying predictions at a minimum of 9% away from the other models–Georgia being an exception as all three models are within 6% of each other. The Oracle predicts much higher chances of Trump winning in Florida and Arizona than 538 and The Economist, but much lower chances of Trump winning in Texas than the other models.
References
2020 Election Forecast. (2020, November 1). FiveThirtyEight. Retrieved November 1, 2020, from projects.fivethirtyeight.com/2020-election-forecast/.
Arizona-Forecasting the US 2020 elections. (2020, November 1). Retrieved November 01, 2020, from https://projects.economist.com/us-2020-forecast/president/arizona
Florida-Forecasting the US 2020 elections. (2020, November 1). Retrieved November 01, 2020, from https://projects.economist.com/us-2020-forecast/president/florida
Georgia-Forecasting the US 2020 elections. (2020, November 1). Retrieved November 01, 2020, from https://projects.economist.com/us-2020-forecast/president/georgia
How The Economist presidential forecast works. (2020, November 1). Retrieved November 01, 2020, from https://projects.economist.com/us-2020-forecast/president/how-this-works
ORACLE of Blair. (2020, October 31). Retrieved November 1, 2020, from https://polistat.mbhs.edu/.
Silver, Nate. (2020, August 12). How FiveThirtyEight’s 2020 Presidential Forecast Works. FiveThirtyEight. Retrieved November 1, 2020, from https://fivethirtyeight.com/features/how-fivethirtyeights-2020-presidential-forecast-works-and-whats-different-because-of-covid-19/.
Texas-Forecasting the US 2020 elections. (2020, November 1). Retrieved November 01, 2020, from https://projects.economist.com/us-2020-forecast/president/texas
