Analyzing the Effects of a Proportional Elector System
History
Every state except Nebraska and Maine delegates all of their electors to the winner of the popular vote in that state. This is called the winner-take-all approach, and the winner does not even need to have a majority — they just need to have a plurality within that state. Meanwhile, Nebraska and Maine use a method known as the congressional district method. In this method, they give 2 electoral college votes to the popular vote winner across the state and 1 electoral college vote to the candidate who wins each congressional district.
The 1824 election was the first presidential election in which a majority of the states used the winner-take-all system. For the 13 presidential elections before in 1824, the states tried many different electoral systems, the most dominant systems being: electors allocated by the state legislature, districts choosing electors, and the statewide winner-take-all method. In the end, states settled on the winner-take-all, not because of it being ideal, but because it would help the dominant party in the state win the presidential election.
Our model will work differently than either of the 2 methods discussed above. In this post, we discuss the effect of a proportional elector system within the confines of the established electoral college. This system will explore allocating electors in each state based on the proportion of the popular vote each candidate won within the state.
There are many problems with the current delegation of the electoral votes in states during the national election, which is why alternate methods such as ours have been proposed. The current system leads to victories with immense win margins, even if the candidates were very close in the popular vote. A very strong example is the 1984 election between Reagan and Mondale. In 1984, if one looked at the electoral college votes, they would think that Reagan won by a landslide and that Mondale was very unpopular. In reality though, Reagan only secured 58.8% of the popular vote, while winning 97.6% of the electoral college’s vote.
A more pressing problem with the current winner-take-all system is that it reduces the incentive for voters of a non-dominant party in a state to vote in an election with a clear winner. This in turn reduces voter turnout, and it makes states other than the battleground states appear unimportant to the candidates’ campaigns. For example, states like California, Massachusetts, and New York are viewed as safe for the Democratic candidate, and states like Alabama, West Virginia, and Tennessee are considered safe for the Republican candidate. This notion of predetermined results makes it so that the candidates do not feel the need to campaign in the non-battleground states, and campaign promises are geared towards battleground states. This may cause candidates to ignore the needs of safe states, as they either believe they will certainly win or that they will certainly lose, and no further energy spent on the state will alter the outcome. Also, in 2016, 91.48% of the campaign stops occurred in 11 projected swing states. Campaign events were seen as “events that were open to the public, free, and whose primary purpose was to influence local voters of the area in which the event occurred.” Frequent campaign stops occurring almost exclusively in swing states can often create the sentiment among voters in safe states that their vote doesn’t matter or that the candidates don’t care about them. However, these safe states aren’t the landslides that most people would assume. In the 2016 election, Republican candidate Donald Trump got 38.2% of the 2-party vote in New York, and Democratic candidate Hillary Clinton got 35.6% of the vote in Alabama. This trend was consistent across the nation, as between all 50 states (excluding DC, which is technically not a state but is included in our analysis) both parties received a minimum of one fifth of the vote. It seems strange that in most states, where at least 20% of the vote went to a candidate other than the winner, that all of the state’s representation should support the winner.
Besides the model we are exploring, another important model that has been proposed is the Popular Vote Compact (PVC). All states that sign the PVC agree to allocate all their electoral votes to the presidential candidate that wins the national popular vote. But a clause in the compact says that the states would only do so if the total electoral college votes in the compact sum to 270 or more. The people who oppose the compact claim that this undermines the purpose of the electoral college and reduces the power the states have. This method also would favor states with a larger population as the candidates would campaign where they could get the most population for the popular vote. The most effective way to do this would be to visit places where there is a high population density. On July 6th, 2020, the Supreme Court heard a case on how the state legislatures could allocate the electoral votes of the state, and whether it could force electors to vote for a certain candidate. According to the Supreme Court, the states have all the power to decide how the electors vote, and that they could make laws that held the electors accountable. This was in response to 7 “faithless” electors in 2016 who didn’t give their vote to the winner of the popular vote in the state as they normally would in the winner-take-all system. It also showed that the PVC was legal and states could join, as they have the power to choose how the electors vote.
Methodology
To explain the difference between the current method and the new method we explored, we can use California as an example. We perform our calculations in terms of a two-party vote, such that we determine the proportion of votes each party received while only considering votes for the Democratic or Republican candidates. While we do have 3rd party data from past elections, our model this year displays results in terms of the two-party vote, as the effect of a 3rd party on national elections is negligible. Even in a proportional system, a 3rd party would likely only take one or two electors and as such would only be a factor in an extremely close election.
In the 2016 presidential election in California, the two-party vote distribution was 33.87% for Donald Trump and 66.12% for Hillary Clinton. Due to the current winner-take-all system, Clinton was awarded all 55 of California’s electors. The proportional system we are exploring would award electors for a state according to the proportion of the popular vote each candidate received within that state. In the California example, Trump would therefore receive 33.87% of the electors and Clinton would receive 66.12%. The number of electors would be calculated with the following raw formula:
(# of electors) x (proportion of vote received by candidate) = # of electors received by candidate
However, an immediate flaw can be seen in the above system - fractional electors. Results need to be in terms of whole electors. To solve this, we decided on four methods to deal with fractional electors:
- Basic rounding
- Allocation of remainder using Blair Partisan Index (BPI)
- Allocation of remainder using governor affiliation
- Allocation of remainder using senator affiliation
The Senate method is not perfect - Senate affiliation can be a tie (one Republican, one Democrat), so for the Senate affiliation method we created three versions, each one using a different previously described rounding method to break ties.
With the basic rounding method, we rounded the number of electors to the nearest whole number. If the raw formula gave a candidate 1.6 electors, that would be rounded up to 2. If the raw formula gave a candidate 3.4 electors, that would be rounded down to 3. For the next method, where the remaining elector was assigned by BPI, we treated the partisan lean as an indicator of how the state would decide to place the remaining elector. If the BPI calculated for a state with the 2020 ORACLE model was positive, indicating a partisan lean towards the Republican Party, the electors for both parties would be rounded down, and the remaining unassigned elector would be given to the Republican candidate. The opposite would happen if the BPI was negative, indicating a partisan lean towards the Democratic Party. The third rounding method used the same technique as BPI, but instead used party affiliation of the governor to assign the remaining elector. The candidate whose party affiliation matched the governor’s party affiliation received the remaining elector.
As mentioned previously, there is potential for a tie using the Senate method. If both of a state’s senators were from the same party, we rounded according to that party affiliation, giving the candidate whose party was represented in the Senate the remaining elector. If there was a party conflict between Senators, we used the Governor affiliation, BPI, or basic rounding as tie breakers. If a state had an Independent senator (regardless of the party they caucused with), we treated them as “invisible,” then looking only at the party affiliation of the other senator.
In order to simulate the 2020 presidential election with our proportional elector system (PES), we first pulled the predicted two-party votes for each state (and DC) from the Blair ORACLE model, on October 19, 2020. We removed the unique elector allocation system for Maine and Nebraska for uniformity, and instead calculated a statewide predicted popular vote percentage using the following formula:
Σ (district population x district vote prediction) / state population = district popular vote proportion
Using these two-party predictions for each state and the number of electors from each state, we calculated the number of electors allocated to each candidate, using the raw formula from the second paragraph of the methodology section. We subsequently applied each of our rounding methods, described above, to determine how many whole electors each candidate would receive for each state. For the Governor and Senate methods, we found the party affiliations of the current governor and senators in 2020. Lastly, we summed the number of electors for Trump and for Biden to determine the predicted electoral margin.
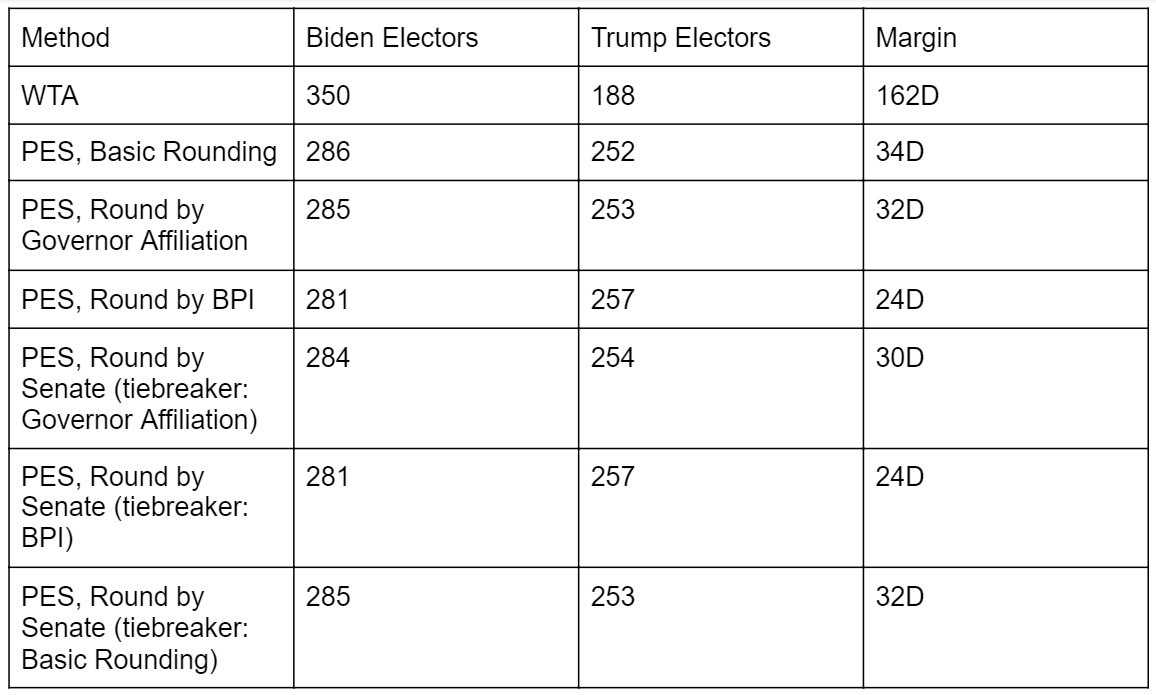
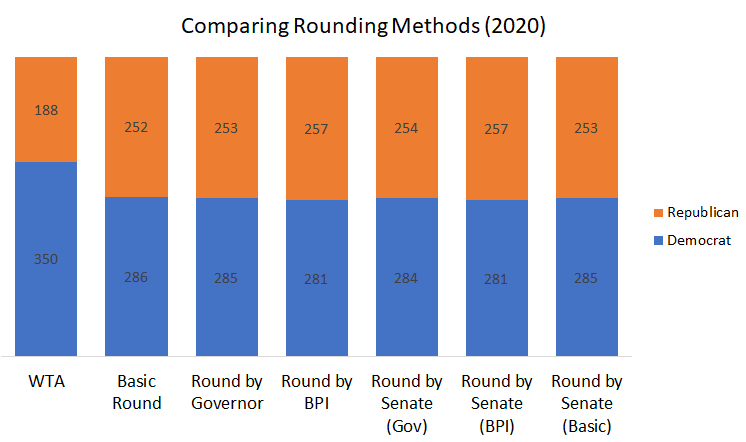
Table 1 summarizes the predicted number of electors for each candidate under the normal electoral college winner-take-all (WTA) system as well as our proportional elector system (PES) methods. Figure 1 is a different representation of the same data.
Table 1: Predicted Electoral Distribution for Winner-Take-All (WTA) and Proportional Elector System (PES) methods. Based on predictions of 2020 Blair ORACLE model on 10/19/2020

 Figure 1: Visual representation of predicted electoral vote counts using WTA method and PES with various rounding methods. For Senate rounding methods, the method in parentheses is the tiebreaker. Based on predictions of 2020 Blair ORACLE model on 10/19/2020
In addition to analyzing the effect a PES would have on the 2020 election, we applied it to the 2016 and 2012 presidential elections. Seeing that the margins between the different rounding methods were very similar in the 2020 predictions (we will expand on this idea in the discussion), we solely focused on the basic rounding method when comparing actual electoral college results from the past elections to our PES result.
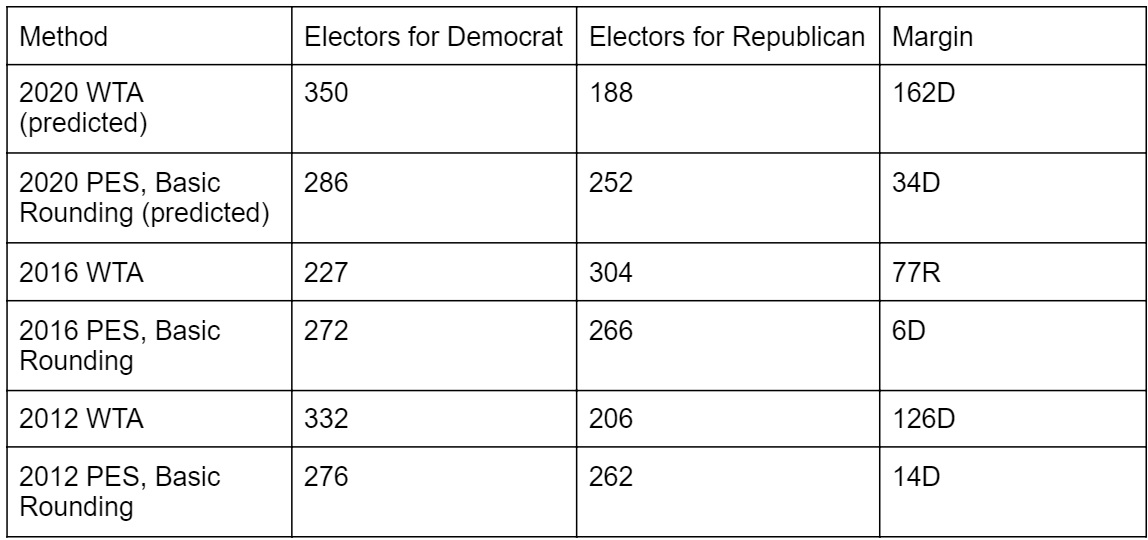
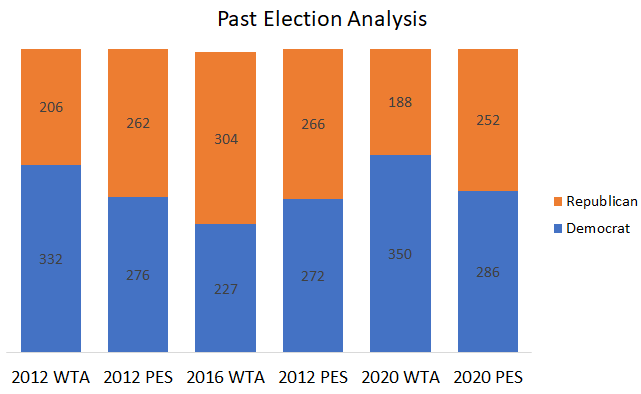
To calculate the PES vote totals for the 2016 and 2012 elections, we used the state vote percentages for each party from the Federal Election Commission. The vote percentages were converted into two-party vote percentages and the PES method, with basic rounding, was applied. Just as with the 2020 prediction, the number of electors for each candidate was summed using the WTA and PES methods. Table 2 summarizes the electoral vote distributions for 2016 and 2012 presidential elections under the WTA and PES result with basic rounding (applied to the actual election results) as well as the 2020 predictions using both methods. Figure 2 presents the same data in a different format.
Table 2: Electoral Distribution for Winner-Take-All (WTA) and Proportional Elector System (PES), basic rounding, methods. Data based on 2016 and 2012 election results and Blair ORACLE predictions for 2020.

 Figure 2: Visual representation of electoral votes counts given to each candidate using WTA and PES, basic rounding, in the 2012 and 2016 elections and predictions for 2020 using WTA and PES methods (Note: 2016 WTA electors add to 531 rather than 538 because of faithless electors).
Discussion
With the assumption that the predictions from the 2020 ORACLE model are reasonably correct, we conducted a two-proportion z test (α=0.05) to determine if the new proportional elector system would have a statistically significant difference in results from the current method. The proportion of electors awarded to Trump under the current winner-take-all system was compared to the proportion of electors awarded to Trump if the proportional system was adopted, using the basic rounding method to handle fractional electors.
Only the basic rounding method was used here because we found the various rounding methods to have remarkably similar results. Performing a similar two-proportion z test to compare all of the other rounding methods to the basic rounding method, we found that the basic rounding method was not statistically different from the method using BPI (P = 0.76), the method using Governor affiliation (P = 0.95), or any of the Senate rounding methods (P = 0.76, 0.90, and 0.95 for BPI, Governor, and basic rounding tiebreaker methods respectively). Since the basic rounding model could not be proven to be significantly different from any of the other methods, the basic rounding method was the only one used when comparing the proportional elector system to the winner-take-all system, as it was the simplest choice. In addition, basic rounding is strictly numerical and does not rely on a calculated metric of partisan lean or current elected official. We believe that if a proportional elector system was adopted, the basic rounding system would probably have the easiest time receiving bipartisan support, as it seems inherently fair.
We did find a significant difference between the predicted 2020 electoral vote share using the current winner-take-all method across each state and using the proportional elector method across each state (P < 0.001). We also repeated the process for 2016 and 2012, using the actual reported results for each state — no longer relying on predictions. In 2016, the difference was less pronounced (P = 0.02) but still significant, and the difference was very significant again in 2012 (P < 0.001). As the odds for these sizable differences between proportions to occur by chance are consistently less than 5%, our stated significance level, the differences between the WTA and PES models are significant. Therefore, we conclude that the proportional elector system model we explored is different from the current system, and as such implementing it could easily change the results of elections.
However, there are still some facets of our results that are interesting to explore. To start, why were some rounding methods more similar to the other rounding methods for our proportional elector system? The Governor rounding method and the Senate rounding methods using basic rounding and Governor affiliation as tiebreakers were all remarkably similar to the basic rounding method we decided on, with P-values above 90%. Meanwhile, both models which used the BPI had P-values of approximately 76%. This may be due to the amount of information in the BPI metric created for use in the 2020 ORACLE model. The Senate composition and Governor occasionally go against the results that are commonly seen in the presidential elections - this can be seen in the authors’ home state of Maryland, which has a Republican governor but consistently votes for the Democratic candidate in presidential elections. However, the BPI takes into account the past 4 elections, including the 2012 and 2008 general presidential elections, and as such the inclusion of partisan lean present in general elections may cause differences. Sadly, it is still unclear why basic rounding would be more similar to the Senate and Governor methods than the BPI methods.
An interesting discovery was also made regarding exactly how the proportional elector system affects the proportion of electors awarded to each candidate. We found that, across all three elections observed, the proportional elector system brought the electoral vote split closer to 50/50. This is because while candidates can rack up huge electoral vote margins by winning key states and receiving all of their electors under the current system, they often win many of these states by a narrow margin. In the proportional system, states won by a small margin have their electoral votes split evenly among both candidates. Only in states with an odd number of electors would a small margin boost a candidate’s chance of winning, and even then, it would only give them 1 elector over their competitor.
It is important to go back and observe the assumptions made at the beginning of the work, and in particular, the assumption that the 2020 Blair ORACLE model is correct in its predictions on the division of the popular vote within each state. In the current winner-take-all method, all that matters is that the model selects the correct winner within some set of reasonable bounds so that on repeated simulations it swings to each candidate a number of times that represent the odds of each candidate winning the state. However, to use a model to predict an election in a proportional system, the exact prediction needs to be correct. A 5% difference in a candidate’s popular vote chance may not greatly affect the results in a winner-take-all system for a state with strong partisan lean, but it could easily affect the allocation of multiple electors in a proportional system. However, given the magnitude of the difference between the winner-take-all model and the proportional elector system, we believe that even if the assumption is slightly violated the two methods are still significantly different.
One question that may be raised by our project, especially considering the demonstrated pull towards the 50/50 divide, is whether or not the proportional elector system that divides electors by proportional vote in each state is really all that different from abolishing the electoral college and deciding the election based on the national popular vote. Indeed, the results of our method are not significantly different from the predicted results using the national popular vote to award electors in 2020 (P = 0.46), nor from using the national popular vote to award electors in 2016 and 2012, which had remarkably similar P-values (P = 0.85). Therefore, we cannot prove that our model’s results are different from simply using national popular elections to allocate electors. However, it does not involve the removal of the electoral college, which would require a messy litigation process that has already been revealed in previous calls to remove the college, and allows for some of the safeguards provided by the electoral college to remain. Therefore, if the results are what matters, perhaps it would be better to use a proportional system by state as outlined here rather than abolish the electoral college.
References
270toWin (n.d.). Split Electoral Votes in Maine and Nebraska. 270toWin.com. https://www.270towin.com/content/split-electoral-votes-maine-and-nebraska/
270toWin. (n.d). Gaming the Electoral College: Alternate Allocation Methods. 270toWin.com. https://www.270towin.com/alternative-electoral-college-allocation-methods/?year=2016
Fadem, B. (2020, July 14). Supreme Court’s “faithless electors” decision validates case for the National Popular Vote Interstate Compact. Brookings. https://www.brookings.edu/blog/fixgov/2020/07/14/supreme-courts-faithless-electors-decision-validates-case-for-the-national-popular-vote-interstate-compact/
FairVote. (2016, November 9). 2016 Presidential Candidate General Election Events Tracker [data set]. FairVote. https://docs.google.com/spreadsheets/d/14Lxw0vc4YBUwQ8cZouyewZvOGg6PyzS2mArWNe3iJcY/edit#gid=0
Federal Election Commission. (2013, July). Federal Elections 2012: Election Results for the U.S. President, the U.S. Senate and the U.S. House of Representatives [data set]. Federal Election Commission. https://www.fec.gov/resources/cms-content/documents/federalelections2012.pdf
Federal Election Commission. (2017, December). Federal Elections 2016: Election Results for the U.S. President, the U.S. Senate and the U.S. House of Representatives [data set]. Federal Election Commission. https://www.fec.gov/resources/cms-content/documents/federalelections2016.pdf
National Conference of State Legislatures. (2020, January 27). National Popular Vote. NCSL. https://www.ncsl.org/research/elections-and-campaigns/national-popular-vote.aspx
National Governors Association. (2020, January 14). GOVERNORS ROSTER 2020 [data set]. National Governors Association. https://www.nga.org/wp-content/uploads/2019/07/Governors-Roster.pdf
National Popular Vote. (2020, September 11). Two-thirds of 2016 Presidential Campaign Was in Just 6 States. https://www.nationalpopularvote.com/campaign-events-2016
ORACLE of Blair. (2020, October 19). [Blair High School 2020 Presidential Election Predictions]. Retrieved October 19, 2020 from https://polistat.mbhs.edu/
United States Senate. (n.d.). Senators. United States Senate. https://www.senate.gov/senators/index.htm
Wikipedia contributors. (2020, October 20). 1984 United States presidential election. Wikipedia. https://en.wikipedia.org/wiki/1984_United_States_presidential_election
