How have Republicans shifted their views on Trump between 2016 and 2020?
Introduction
President Donald Trump has been among the most controversial and divisive presidents in US history.
For the past 4 years, he has reshaped the federal judiciary, established the sixth branch of the US Armed Forces — the Space Force, and signed the First Step Act into law, marking the first legislative victory in years for advocates seeking to reform the criminal justice system.
However, there have been arguments over his leadership and priorities. Amid the COVID-19 pandemic, hundreds of thousands of Americans have died, and millions are left unemployed. Racial tension heightened in the US following the murder of George Floyd, Ahmaud Arbery, and Breonna Taylor at the hands of law enforcement.
Here we investigate the shift in Republican’s view after Trump’s four-year presidency by comparing polls from 2016 to 2020 in Republican states.
Methodology
We started off by identifying large conservative and republican states with larger amounts of poll data (Alaska, Georgia, Indiana, Montana, South Carolina, Missouri). For each of these states, we recorded the ten latest poll data from FiveThirtyEight for 2020, and ten poll data from a similar time period in 2016. We then used two-sample t-tests comparing the percentages from 2016 and 2020 to determine whether there exists a significant change in Trump’s polls in the past 4 years. Below are the null hypothesis and alternate hypothesis we set.
\(H_0\) (null hypothesis): There is no significant difference in Trump's two-party vote percentages between 2016 and 2020.
\(H_A\) (alternate hypothesis): There is a significant difference in Trump's two-party vote percentages between 2016 and 2020.
Results and Analysis
| State | P-value |
|---|---|
| Alaska | 0 |
| Georgia | 0.048 |
| Indiana | 0.002 |
| Missouri | 0.105 |
| Montana | 0.007 |
| South Carolina | 0 |
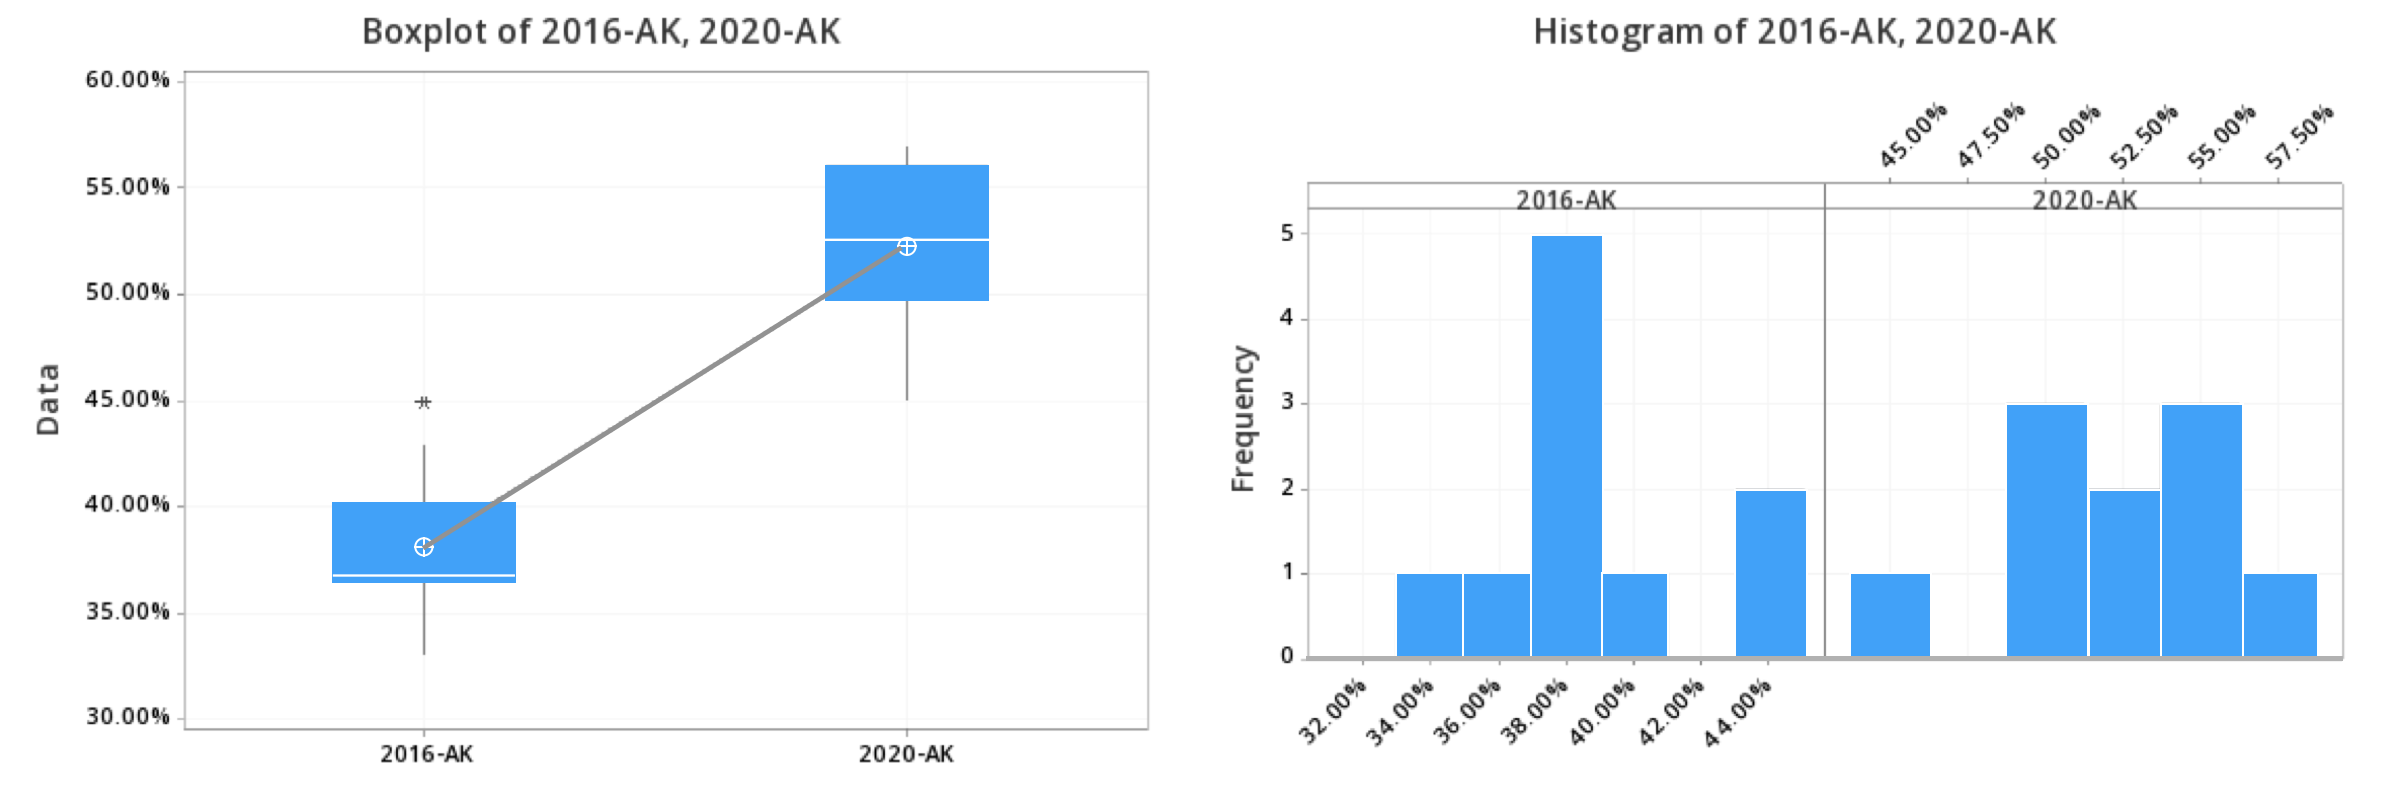
Alaska
Alaska has been consistently voting Republican since 1968, with only one exception. Here we see the p-value=0 is less than the significance level of 0.05, so we reject the null hypothesis. If I assume that there is no significant difference in Trump's two-party vote percentages between 2016 and 2020, there is a 0% of seeing results as different as these. Since this is incredibly low, we have evidence to suggest that there is a significant difference in Trump's two-party vote percentages between 2016 and 2020. Over the two elections, the mean percentage increased from 0.3820 to 0.523. Both graphs are bimodal, slightly skewed left, and relatively naughty as they have gaps between data points, though the 2020 graph is more uniform. The spread for 2020 is slightly wider than for 2016, as the standard deviation is 0.0383 compared to 0.0346.
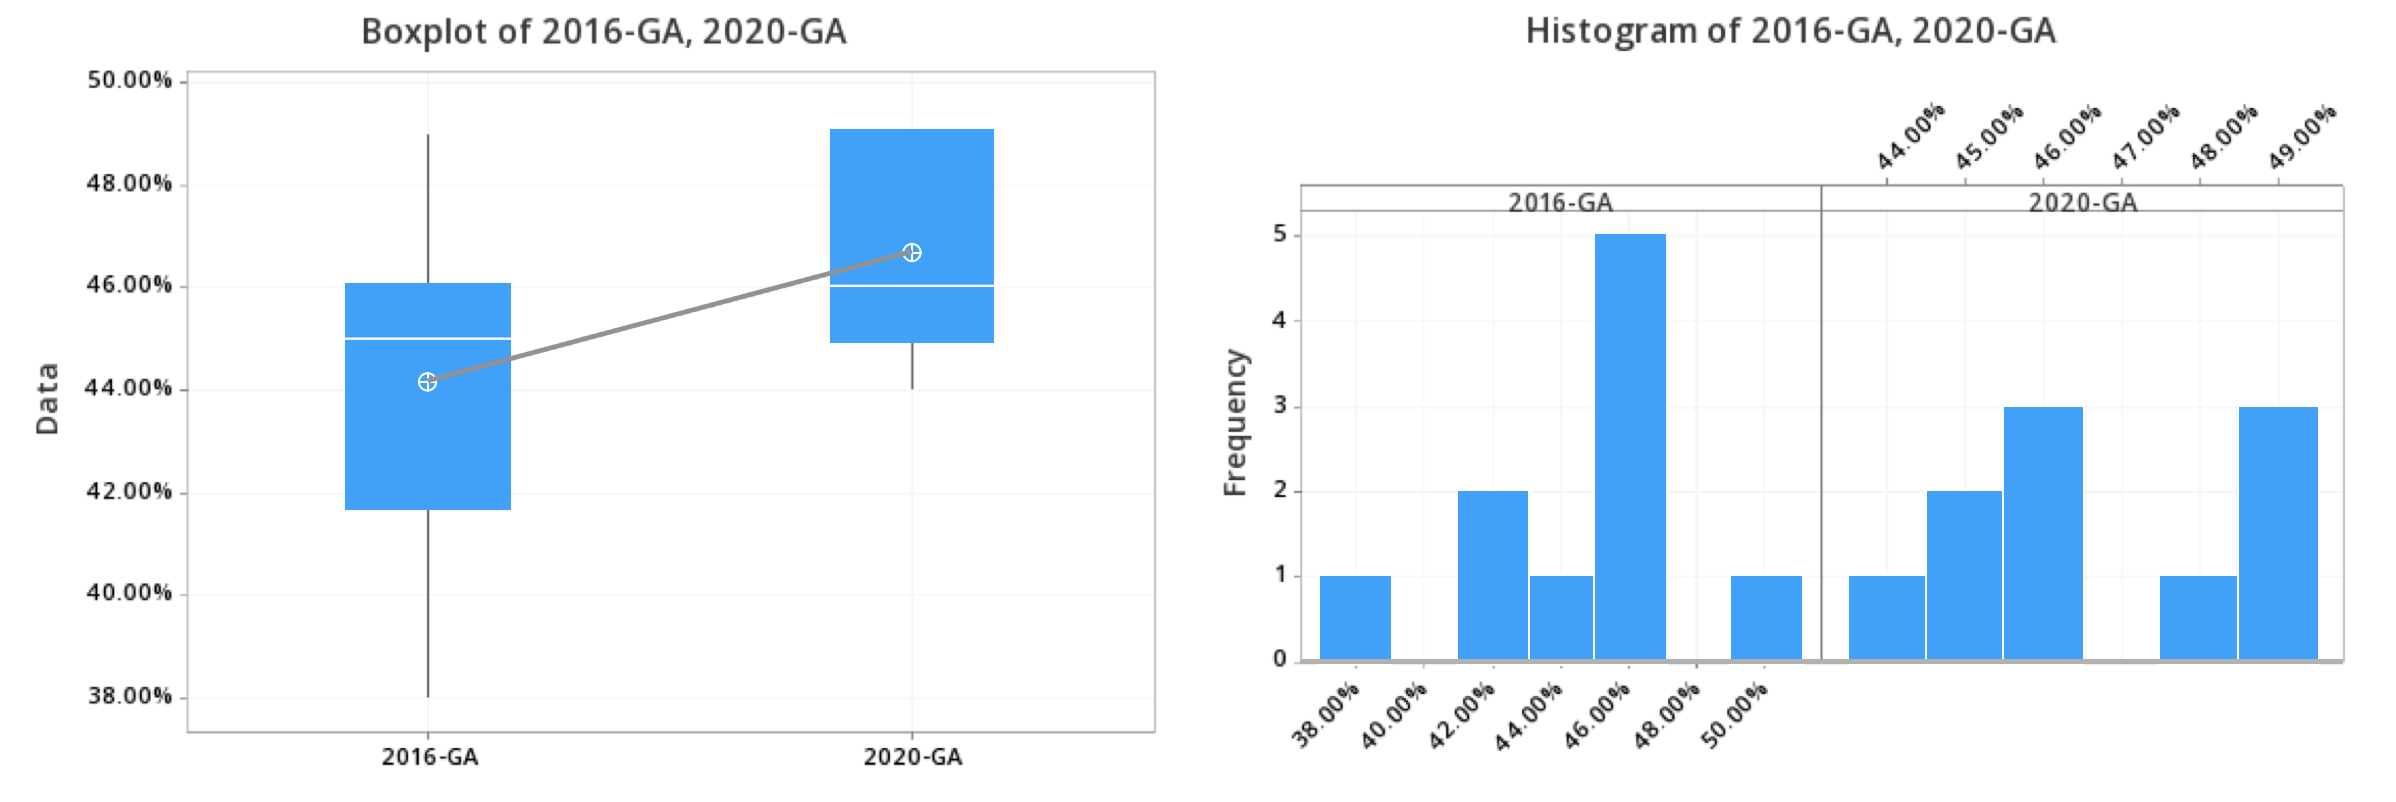
Georgia
From 1868 through 2002, Georgia has been consistently Republican in the last few elections. Recently, FiveThirtyEight has labeled Georgia as a swing state. In this poll analysis, the p-value=0.048 is less than the significance level of 0.05, so we reject the null hypothesis. If I assume that there is no significant difference in Trump's two-party vote percentages between 2016 and 2020, there is a 4.8% of seeing results as different as these. Since 4.8% is really low, we can reasonably assume that there is a significant difference in Trump's two-party vote percentages between 2016 and 2020. Over the past two elections, the mean percentage increased from 0.4420 to 0.4670. The 2016 graph is unimodal and slightly skewed left, while the 2020 graph is bimodal and slightly skewed right. However, both are relatively naughty as they have gaps between data points and no clear trend. The spread for 2016 is slightly wider than for 2020, as the standard deviation is 0.0312 compared to 0.0189.
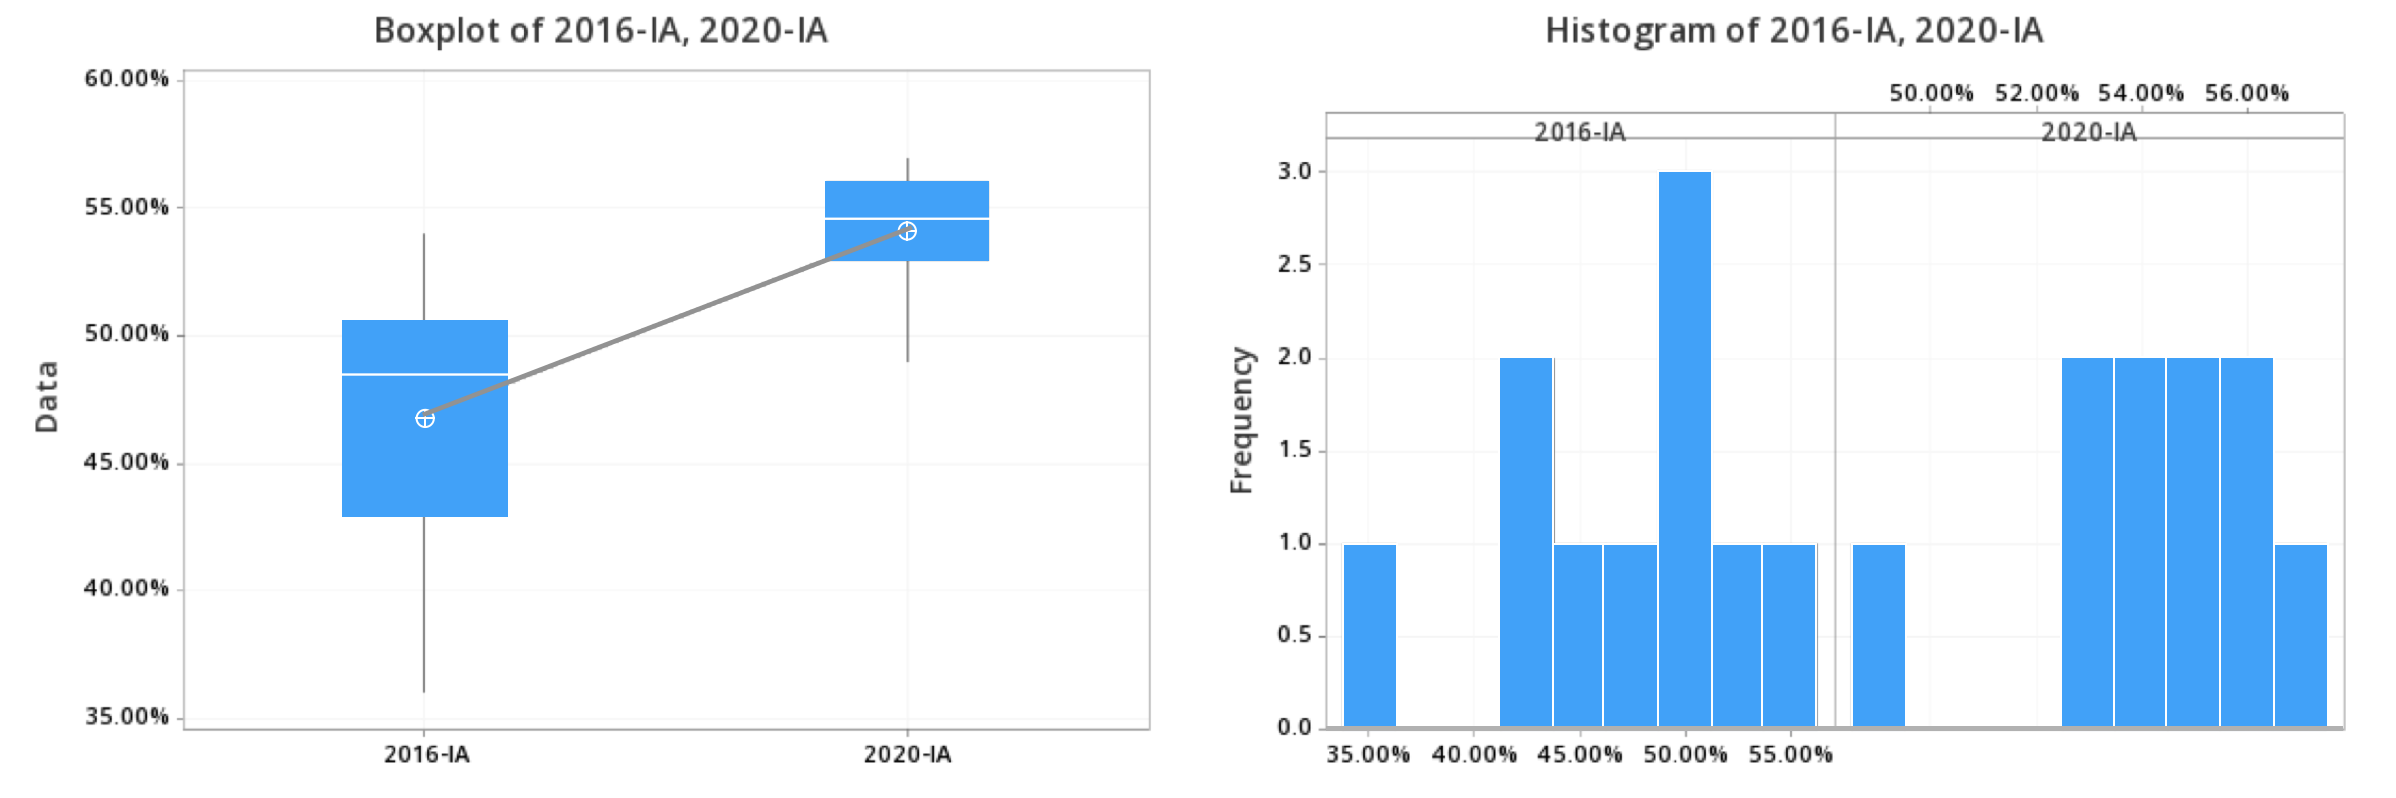
Indiana
Indiana has been primarily Republican since 1816, and today is the “reddest” state in the Midwest. The p-value=0.002 is less than the significance level of 0.05, so we reject the null hypothesis. If I assume that there is no significant difference in Trump's two-party vote percentages between 2016 and 2020, there is a 0.2% of seeing results as different as these. Since 0.2% is close to 0% and is incredibly low, we have strong evidence to reason that there is a significant difference in Trump's two-party vote percentages between 2016 and 2020. Over the past two elections, the mean percentage increased from 0.469 to 0.542. The graphs for both years are bimodal and skewed left, though the 2020 graph is more uniform. However, both are relatively naughty as they have gaps between data points. The spread for 2016 is much wider than for 2020, as the standard deviation is 0.0526 compared to 0.0225.
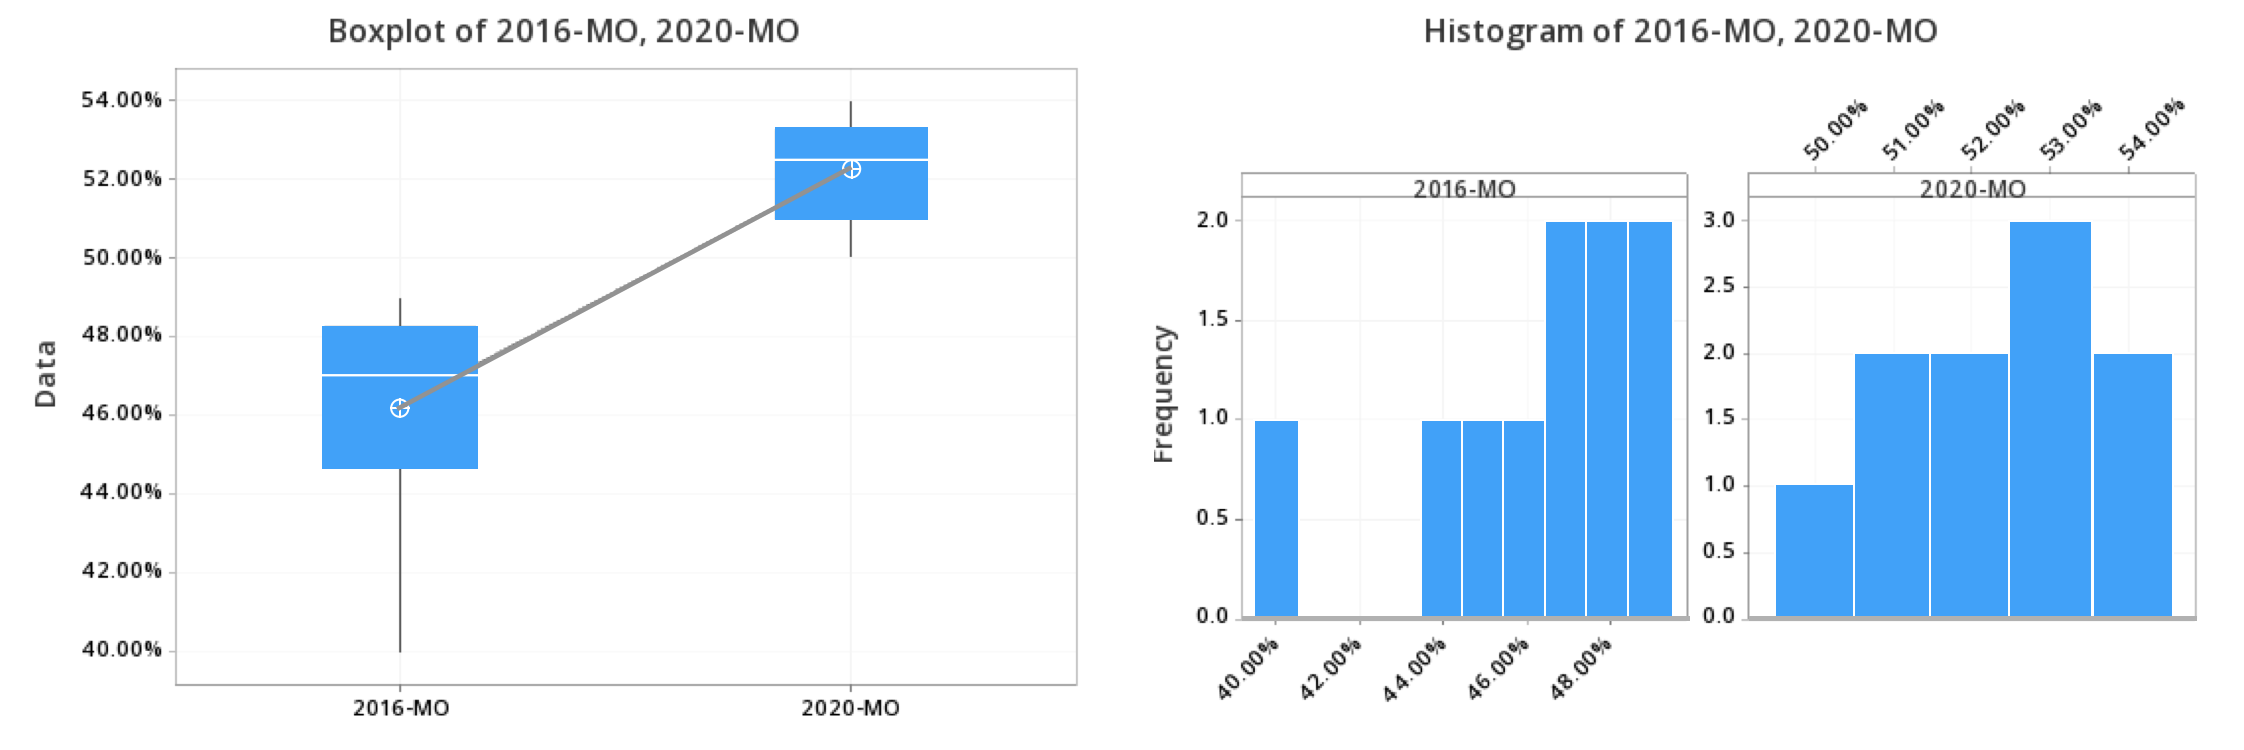
Missouri
From 2000 to 2016, Missouri voted for Republicans consistently. Looking at the most recent poll data, Trump still takes the majority of voters in the state. If it is assumed that there is no significant difference in Trump's two-party vote percentages between 2016 and 2020 in Missouri, then there is a 0.7 percent chance of seeing the result as extreme as this. This is a very low number, so there is enough reason to assume that the changes in Trump’s two-party vote are significant. Overall, the mean increased from 46.3% to 52.3% over the past 4 years. The data is unimodal and skewed to the left for 2016, while it is much more uniformed for 2020. The spread is slightly bigger for 2016, as the standard deviation is 0.0275 compared to the 0.0134 for the most recent year.
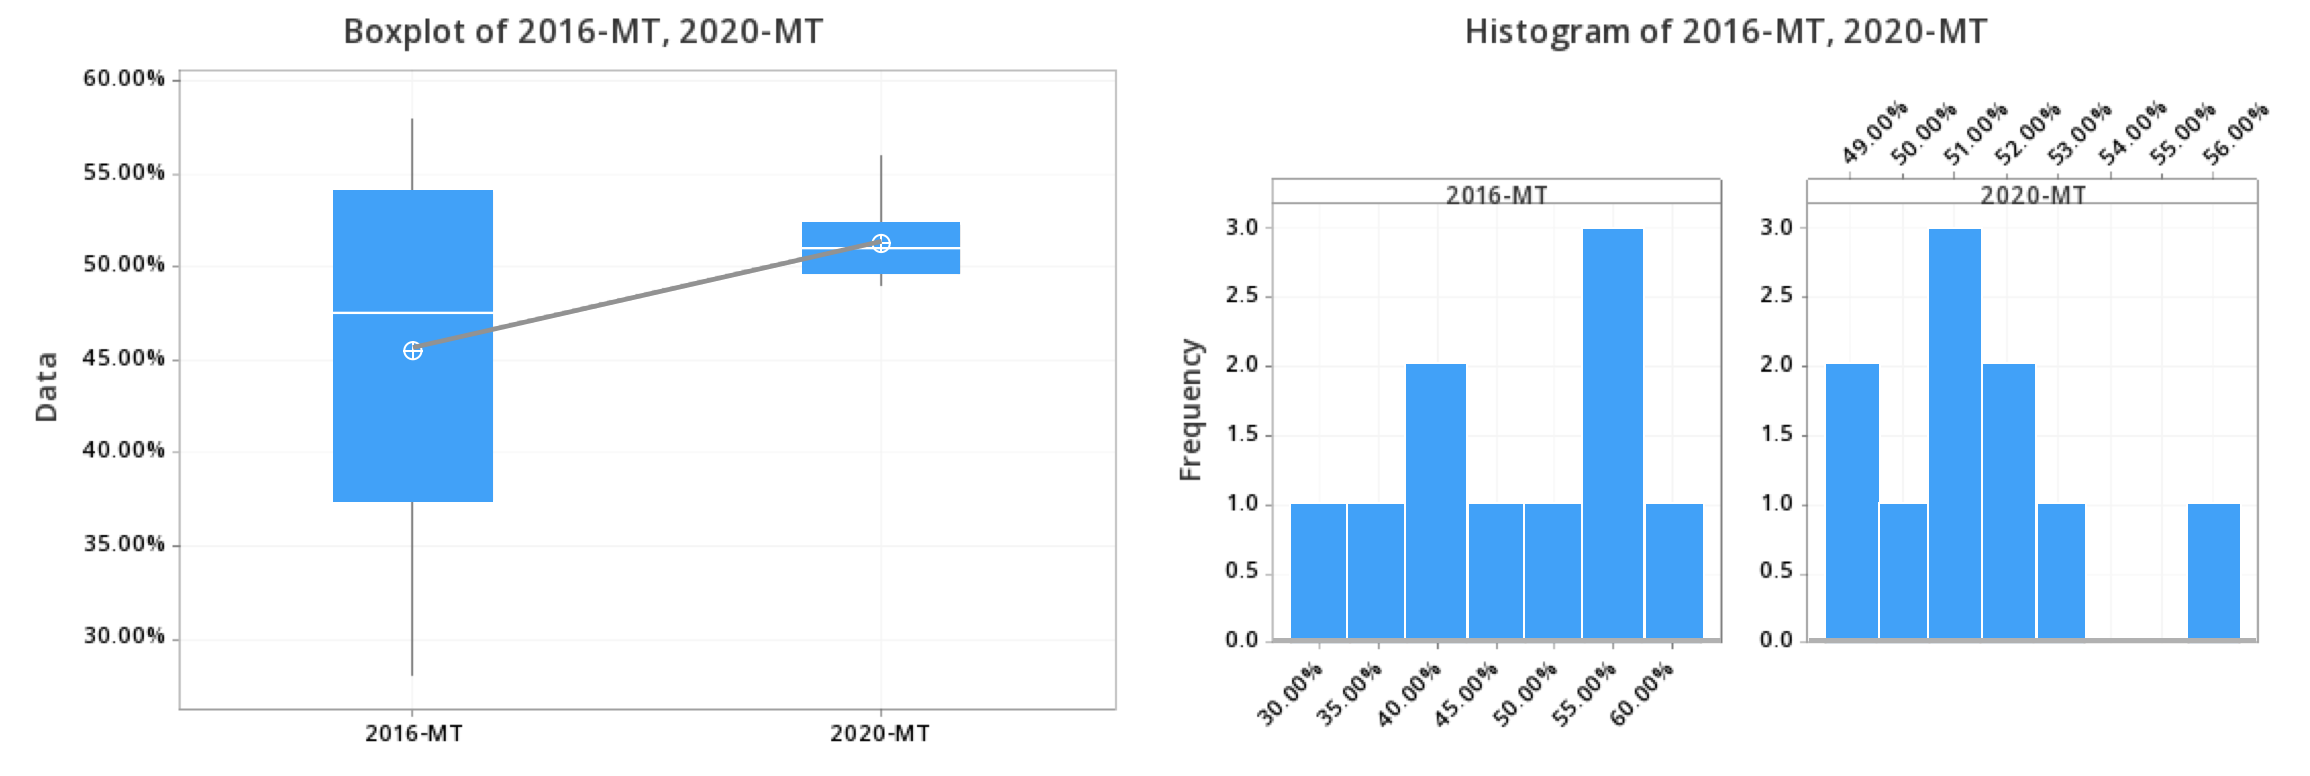
Montana
Montana has been reliably Republican in recent presidential elections, as it only voted for two Democrats since 1952. Recent poll data suggest that Trump continues to take the lead in this state. Over the two elections, the mean increase from 45% to 51.4% .The data for 2016 is bimodal and skewed slightly to the left, while it’s unimodal and skewed to the right for 2020. Both data sets contain no outliers, the standard deviation decreased from 0.0979 to 0.0207 indicating much smaller spread for the most recent data. If it is assumed that there is no significant difference in Trump's two-party vote percentages between 2016 and 2020 in Montana, then there is a 10.5 percent chance of seeing the result as extreme as this. This is not a very low number, so there is little reason to assume that the changes in Trump’s two party vote is significant.
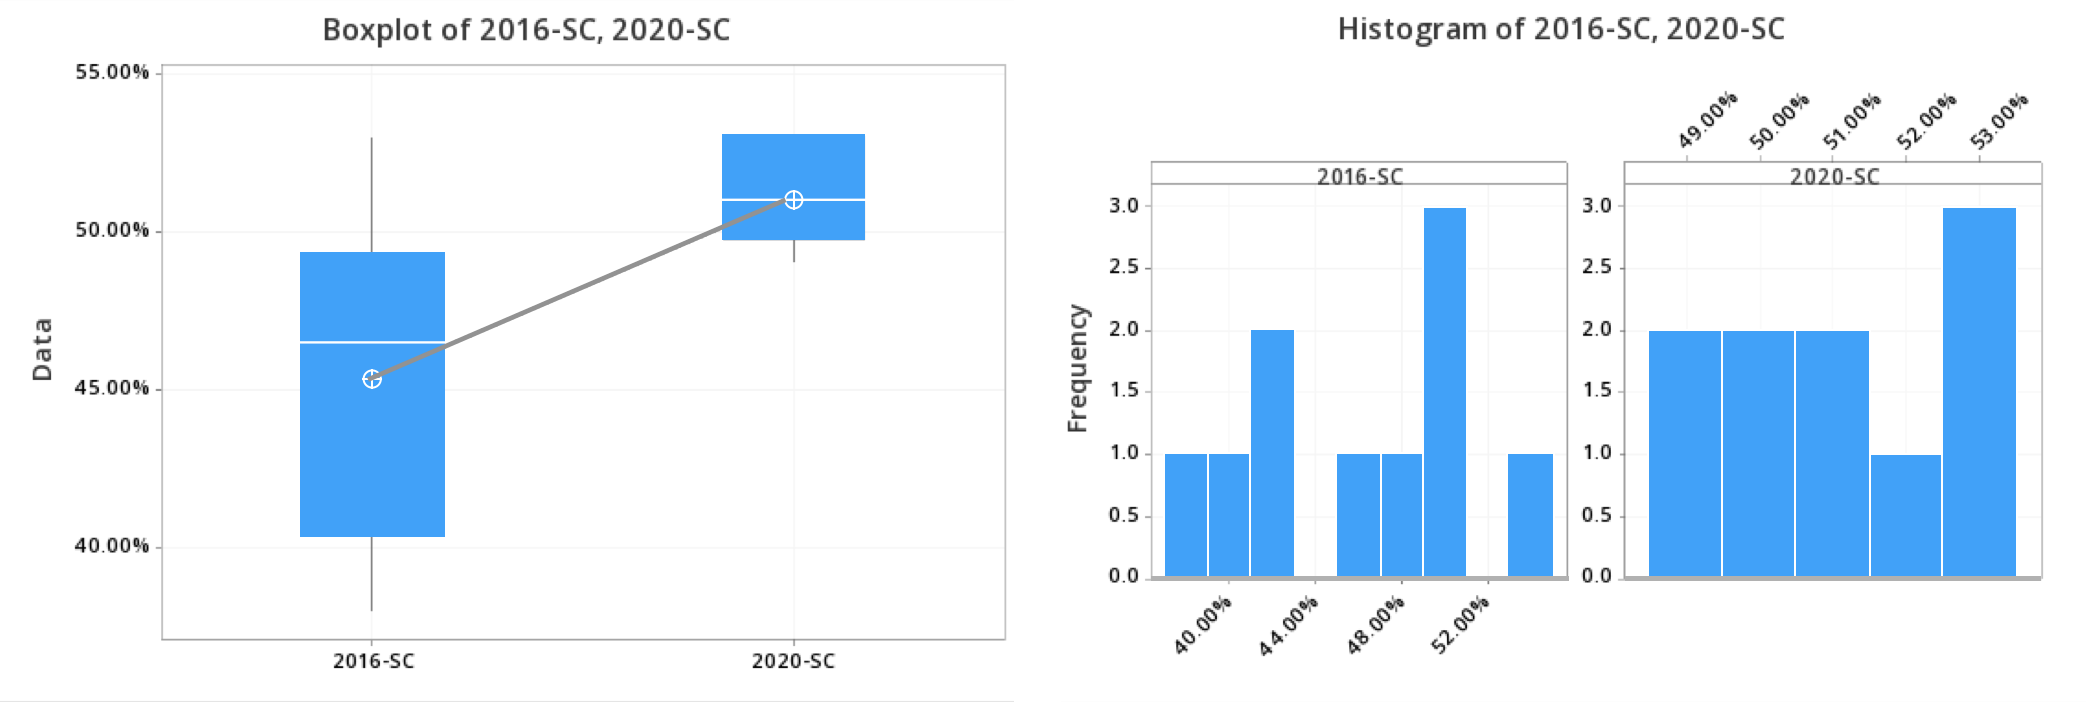
South Carolina
Like most southern states, South Carolina is a largely conservative, Republican state. Looking at past voting trends, South Caroline consistently voted for the Republican candidates in the past 10 elections. The 2 sample t-test results showcase the p-value=0, which is less than the significance level of 0.05, so we reject the null hypothesis. If I assume that there is no significant difference in Trump's two-party vote percentages between 2016 and 2020, there is a 0% of seeing results as different as these. Since this is incredibly low, we have evidence to suggest that there is a significant difference in Trump's two-party vote percentages between 2016 and 2020. Overall, the mean increased from 45.4% to 51.1% over the past 4 years. The data is bimodal and skewed to the left for 2016, while it is much more uniformed for 2020. The spread is much bigger for 2016, as the standard deviation is 0.0515 compared to the 0.0016 for the most recent year.
Conclusion
The states mentioned are all considered to be Republican strongholds, so we are not surprised by the overall increased uniformity in the spread. Trump’s policies over the past 4 years reinforce the favorability from Republican voters, as the polling showcases a consistent increasing trend for Trump support. Though Trump has received various amounts of backlash from both parties during his time in office, we can conclude from this analysis that Trump’s controversies did not affect Republican voters all that much.