What about the Senate?
Introduction
Since the 2020 US Presidential election is on everyone’s mind, it’s easy to forget that one third of the Senate is also up for reelection. The ORACLE of Blair may be designed to predict the results of the presidential election, but since each state has its own prediction, the model can easily be tweaked to predict vote percentages in the 2020 Senate elections as well. What if we used the ORACLE’s methodology to average Senate polls instead?
As America has become more polarized, the correlation between Senate and Presidential Elections has increased in recent elections. In fact, the Pew Research Center finds that 122 of the 139 Senate elections held since 2012 have been won by the candidate aligned with the party that won the state’s most recent Presidential election. In 2018, there were only eight mismatches between Presidential and Senate picks out of 38 races. In contrast, the 2006 elections had nearly a third of its Senate elections won by candidates of a different party compared to that state’s presidential pick. We wondered whether this increase in correlation is present this year. To this end, we attempt to correlate the predicted two-party vote percentages in the Senate, as determined by polling averages, to the ORACLE’s predicted two-party percentages in the 28 states that have Senate polling data. We also correlated the Senate polling averages with BPI, to see if polarization had a significant effect on predicted Senate two-party vote percentages.
Methodology
We obtained the most recent dataset of Senate polls from FiveThirtyEight as of 10/27/2020 and formatted it in a way that could be inputted into the ORACLE’s averaging polls program. This meant removing all polls taken before each state’s Senate primary (and runoffs if the state had one) and removing third-party candidates from the dataset. Since our model this year only has one Democratic and one Republican percentage prediction per state, we did not include any secondary Senate elections occurring in states such as the special elections in Georgia. Our final dataset included 28 of the 35 seats (33 regular elections with two special elections in Georgia and Arizona) up for election this year. We then used the ORACLE’s polling average Z-Test method (see the methodology page) to estimate the predicted two-party vote percentage in each Senate election and ran a linear regression between the Senate two-party polling averages and ORACLE’s predicted two-party vote percentage for the Presidential election. We did not run the Senate polls through the entire ORACLE model because factors such as BPI, which take into account only house and presidential elections, and correlation between states, which do not apply to Senate elections because each state votes for different candidates, may skew the Senate predictions. To confirm that correlation between the Senate and Presidential races was the result of polarization, we performed a linear regression between the Senate voting percentages and BPI. All code used for averaging the Senate polls can be found here.
Data and Discussion
Figure 1: Map of Two-Party Vote percentages for Senate races based on ORACLE's averaging polls method.
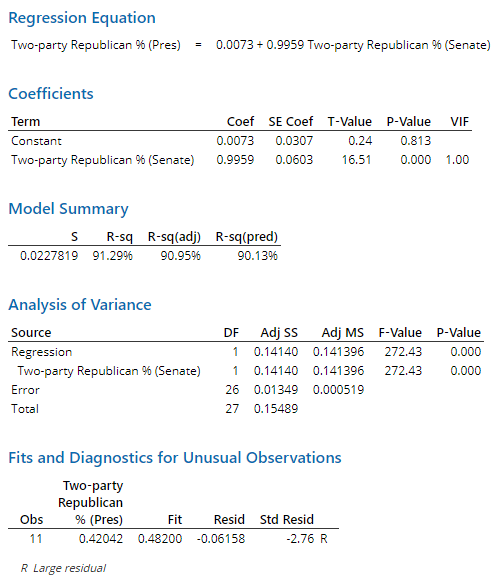
 Figure 2: Linear regression between predicted Republican two-party vote share in the Senate election vs presidential election
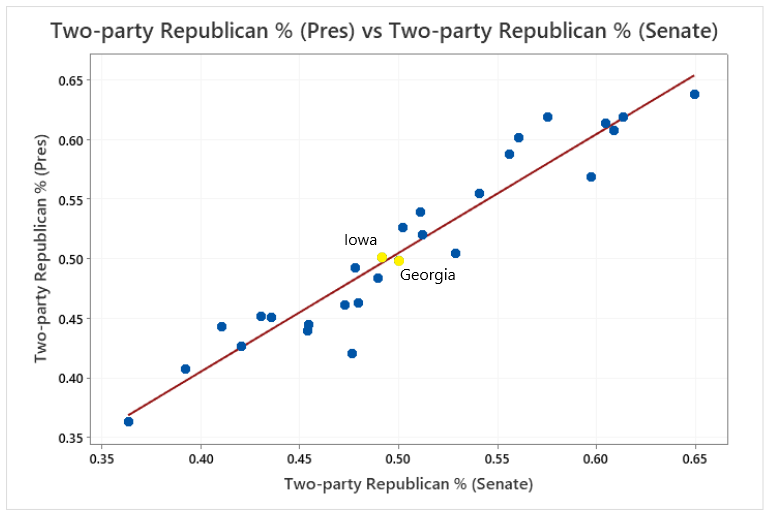
 Figure 3: Graph of Republican two-party vote share in the Senate election (x-axis) vs presidential election (y-axis)
The results from our Senate-presidential linear regression suggest that there is a strong correlation between Senate polling data and the ORACLE’s prediction. About 91.29% of the variation in the ORACLE’s predicted two-party presidential vote share can be explained by the predicted two-party vote share in the Senate as determined by polling data. The regression equation has a constant variable close to 0 and a slope close to 1, which suggests that there is almost a direct relationship (x=y) between the two analyzed variables.
In almost every state, the candidate that is predicted to win the Senate election is from the same party as the candidate predicted to win the presidential election. The only exceptions are Georgia and Iowa, but in both states, the races are very tight. In Georgia, the ORACLE predicts Donald Trump (R) to lose by margin of 0.24% in the presidential election while polling data predicts David Perdue (R) to win by a slight margin of 0.001% in the Senate election. A similar, but opposite trend appears In Iowa, where the ORACLE predicts Donald Trump (R) to win by margin of 0.3% and polling data predicts the Republican candidate, Joni Ernst (R), to lose by a margin of 1.67% in the Senate election.
Although Iowa and Georgia are anomalies when looking at whether the predicted winner of the Senate and presidential elections align, the fact that both races are incredibly tight in the two states reflects the fact that there is a high correlation between the Senate and presidential election predictions.
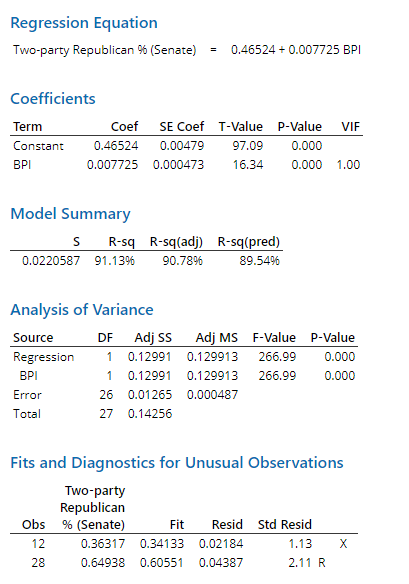
 Figure 4: Linear regression between BPI and the predicted Republican two-party vote share in the Senate election
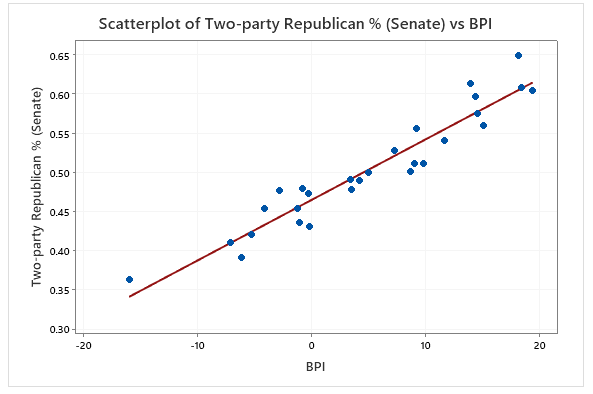
 Figure 5: Graph of BPI (x-axis) vs Republican two-party vote share in the senate election (y-axis)
As expected, the results from the BPI-Senate regression suggest that the BPI is a good predictor of how polarized the Senate elections are in each state. The relationship between the two variables is positive and linear, suggesting that a higher BPI is directly correlated with a higher predicted two-party vote share for the Republican candidate in 2020’s Senate election.
The regression line suggests that the entire Senate election is skewed more towards the Democratic candidate. For instance, a state with a BPI of 4.3, which represents a historic lean towards voting Republican, would be predicted to split its vote evenly between the Democratic and Republican candidates. Additionally, a state with a BPI of 0, which represents a historic neutral stance, would be predicted to side with the Democratic candidate by a fairly high margin of ~6.7%. These findings align with fivethirtyeight’s prediction that the Democrats will win the Senate this year.
Conclusion
Based on our analyses, it seems that the trend of high correlation between Senate and Presidential races will be present again this year. Our linear regression shows a strong correlation between these two variables -- signifying an almost direct relationship between predicted Senate results and Presidential election results. There is also a strong correlation between BPI and predicted Senate voting percentages, demonstrating the strong effect of political polarization and suggesting that our BPI methodology could be a good predictor of Senate vote percentages despite it only taking into account past house and presidential races. In addition, Senate race percentages seem to lean more Democratic as a whole compared to BPI this year. It is important to note that neither the Senate nor the Presidential election has occurred at the time of writing, so the actual election results could potentially be very different. But based on recent trends of increased political polarization, we find this unlikely.
References
Skelley, G. (2015, March 5). Coattails and Correlation. Retrieved October 30, 2020, from https://centerforpolitics.org/crystalball/articles/coattails-and-correlation-examining-the-relationship-between-presidential-and-senate-results/
DeSilver, D. (2020, September 02). Most Senate elections reflect states' presidential votes. Retrieved October 30, 2020, from https://www.pewresearch.org/fact-tank/2020/09/01/most-senate-elections-reflect-states-presidential-votes/
