Analysis of Swing State Polling
Background
A swing state, or battleground state, is a state which the candidates of both the Democratic and Republican party could reasonably win. There multiple ways to define a “swing state.” It could be defined as a state that, if won by one party or another, could determine who wins the electoral college. “Swing state” could also mean a toss-up state (a state with close competition) or a bellwether state (a state with results similar to the national results). Historically, there are around 10 swing states every year. The founder of the widely-acclaimed FiveThirtyEight model, Nate Silver, defines swing states as the tipping point state (the state with the closest margin) and the next five states with the closest margins on each side of the tipping point state. We use this definition in our analysis of swing states. These states are the most likely to be contested and campaigned in, as these states are the most likely to decide the election. This is especially true with the winner-takes-all system, where winning a state influences an election greatly. This important factor has drastically changed the way politicians campaign, as they have directed their attention away from winning the popular vote, and towards winning swing states to secure an electoral college victory, which is what determines the winner of the election. Indeed, there have been five elections where the winning candidate didn’t win the popular vote. As a result, politicians spend over 75 percent of their campaign budgets and most of their time campaigning to win over these crucial populations. For example, Republican candidate Donald Trump and democratic candidate Hillary Clinton spent 71 percent of their advertising money and 57 percent of their campaign appearances on just four key swing states: Pennsylvania, Florida, North Carolina, and Ohio. In the end, Trump’s efforts prevailed, as he would end up winning all four states, effectively ensuring his victory in the election.
A Brief History
The idea of a swing state is not new: the earliest swing states date all the way back to the 1800s, where the competitive election between Aaron Burr and Thomas Jefferson started increasing focus on winning individual states to steal the election (History.com). Perhaps the most famous race where swing states swung the election was the 1948 race between Truman and Dewey. Truman was able to win the election only by winning states such as Ohio, California, Indiana, Illinois and New York by less than a 1% margin. One interesting note here is that as time passes, some states may become more or less polarized. For example, it is well-known that in the modern day, states like California and New York are some of the most left-leaning states in the country. If Trump wants to win the 2020 election, every single vote matters and he needs to win key swing states (more below). Finally, it is important to note that important civil rights initiatives such as the Voting Rights Act of 1965 helped to expand the amount of people who are able to vote. This is particularly interesting because groups with large populations like African Americans can now vote which in turn means that they have a lot of power in influencing elections.
A Look into Current Swing States
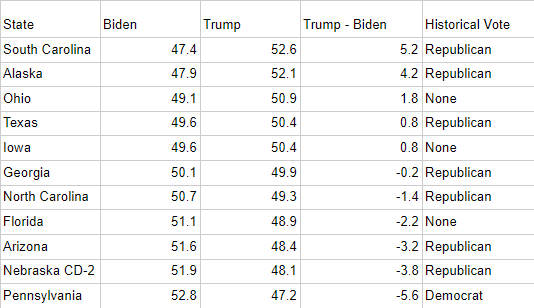
Our model predicts the following swing states this year (in order of most to least competitive): Georgia, Texas, Iowa, North Carolina, Ohio, Florida, Arizona, Nebraska CD-2, Alaska, South Carolina, Pennsylvania. Many of these swing states have historically voted Republican. However, Trump has fallen behind in the election, and now must not only win back the states that would have normally been safe states for him, but also take back key states from Biden.
 This election is unlike any other. With the pandemic forcing the nation to quarantine, many individuals aren’t willing to vote through in-person ballot locations, and are forced to default to absentee ballots. This drastically changes the dynamics of the election, and increases the variability of the poll results. There are so many intervening factors involved in this election, which make the potential error for the polling data extremely high.
Historical Accuracy and Partisan Lean of Polls in Swing States
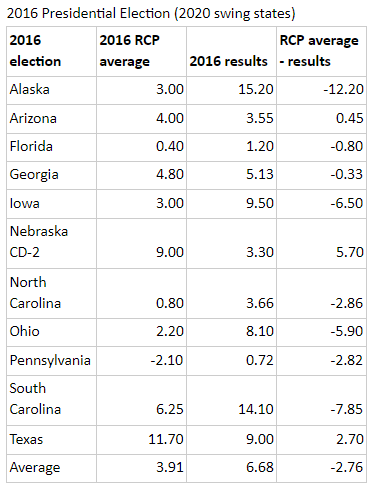
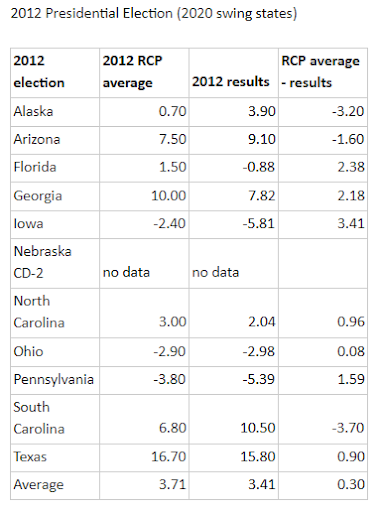
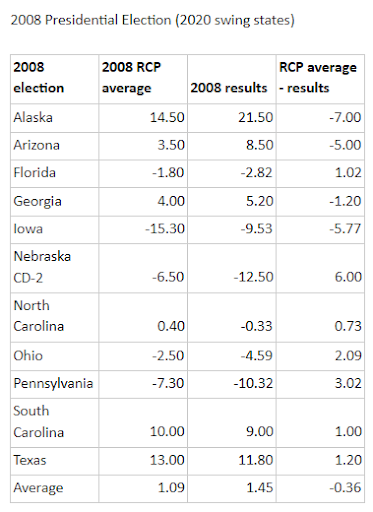
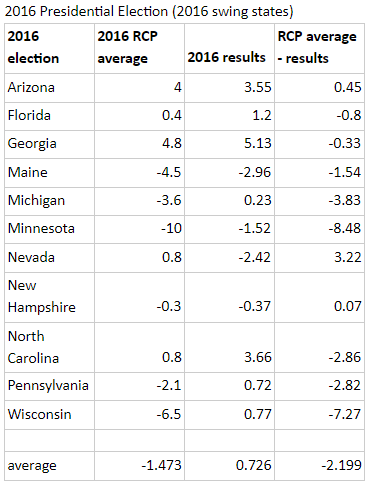
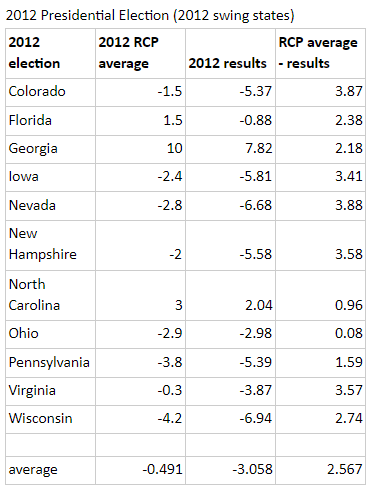
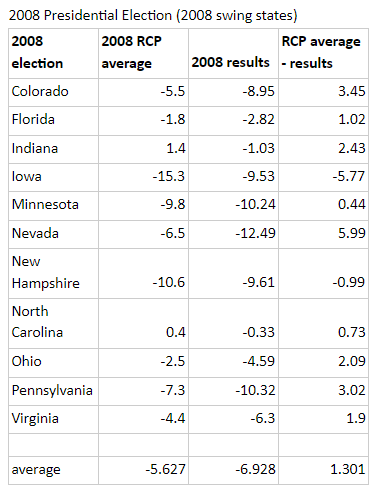
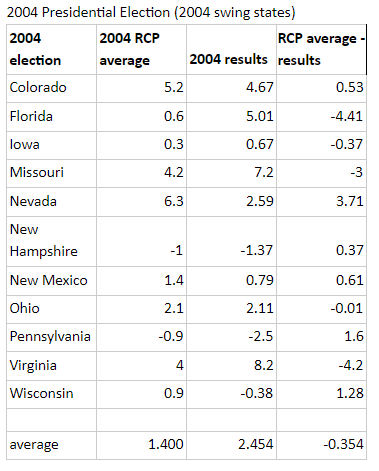
Defining swing states based on Nate Silver’s model, we analyzed the swing state poll results in the last four presidential elections, from 2004 to 2016, and compared the results to that of the actual election results. The results are all based on the overall voting percentage, as opposed to a two-party voting percentage. Positive numbers indicate a Republican lead in the state and negative numbers indicate a Democrat lead in the state. The partisan lean of the poll is created by subtracting the actual results from the polling results. This way, a positive lean indicates that the poll overestimated the Republican vote in the state, whereas a negative lean indicates that the poll overestimated the Democratic vote. Each year contains a row representing the average poll result, election result, and partisan lean for the swing states of that year. In 2004, the polls overestimated the Democratic vote in swing states by 0.35% - a relatively small percentage. In 2008 and 2012, the polls overestimated the Republican vote in swing states by 1.30% and 2.57% respectively. Finally, in 2016, the polls overestimated the Democratic vote in swing states by 2.20%. Thus, in recent years, the polls have overestimated swing state votes in favor of the losing party. In 2016, three of the swing states were predicted incorrectly, which is higher than in 2004, 2008, and 2012, where one, two, and one state were predicted incorrectly.
Historical Accuracy of Polls in This Year’s Swing States
Using the projected swing states for this election, we set out to determine the partisan lean of polls in each state. This was done by analyzing the poll results of the last three presidential elections, from 2008 to 2016 and compared the results to that of the actual election results. Of the eleven swing states this year, four weren’t considered swing states from 2004 to 2016, highlighting how quickly swing states change. Interestingly, all of these states voted for Trump in 2016, suggesting that Trump has lost ground in the polls and previously “safe” states have now become highly contested states. Data for Nevada CD-2 was unable to be obtained during the 2012 election, as Nevada had yet to change its electoral vote distribution system and was still operating with a winner-takes-all system at the time. In 2008, the polls in these states overestimated the Democratic vote by 0.36%. In 2012, the polls overestimated the Republican by 0.30%. In 2012, the polls overestimated the Democratic vote by 0.28%.
So what does this mean for this election?
We analyze each of the swing states for this election individually below. If there is historical data that is relevant, we describe it. Otherwise, we discuss why the state is a swing state this particular election. The goal is to look at historical data and make an observation about the accuracy of the polls (perhaps it has historically always leaned one way for a particular state).
Georgia
In the past three presidential elections, Georgia has voted Republican all three times. Georgia has been a swing state twice in the last four elections (in 2016 and 2012). The polls underestimated the Republican vote in 2008 and 2016 and overestimated the Republican vote in 2012. Currently, the polls predict a 0.2% advantage for Biden - a very small lead. Although Georgia has historically gone Republican, we can’t really be sure how it will swing this election, as the 0.2% lead is far less than any other year in recent elections, where the Republican advantage was no less than 4%. Any overprediction or underprediction of the Republican vote could be enough to swing the vote. This is especially evident given the previous election margins, where the error has been between 0.33% and 2.16%, both of which are much higher than the 0.2% lead.
Texas
Texas has not been a swing state in recent years; historically, it has voted Republican. Polls overestimated the Republican vote by 1.20% in 2008, 0.9% in 2012, and 2.70% in 2016. Trump currently has a 0.8% advantage in Texas - this means that an overprediction of the Republican vote of size similar to previous years would be enough to swing Texas.
Iowa
Iowa was a swing state from 2004 through 2012, though was not a swing state in 2016. Iowa voted Republican in 2004 and 2016 and voted Democrat in 2008 and 2012. Polls overestimated the Democratic vote by 0.37% in 2004, 5.77% in 2008, and 6.50% in 2016, and overestimated the Republican by 3.41% in 2012. Trump currently has a 0.8% advantage in Iowa - this means if the polls overestimate the Republican vote as much as they did in 2012, the state would swing to give Biden a lead. However, if the polls overestimate the Democratic vote as they did in 2004, 2008, or 2016, then that would further Trump’s lead.
North Carolina
In the past three presidential elections, North Carolina has voted Republican two times. North Carolina has been a swing state three times in the last four elections (in 2016, 2012, and 2008). The polls overestimated the Democratic vote in 2016 by 2.86%, and overestimated the Republican vote in 2008 and 2012 by 0.73% and 096%. Currently, Biden has a 1.4% advantage. If the polls overestimate the Democratic vote as much as they did in 2016, it would be enough to swing the state towards Trump.
Ohio
In the past three presidential elections, Ohio has voted Republican one time. Ohio has been a swing state three times in the last four elections (in 2012, 2008, and 2004). The polls overestimated the Democratic vote in 2016 by 5.90%, and overestimated the Republican vote by 2.09% in 2008 and 0.08% 2012. Currently, Trump has a 1.8% lead in Ohio. This means that if the polls overestimate the Republican vote as much as they did in 2008, it would be enough to swing Ohio towards Biden.
Florida
In the past three presidential elections, Florida has voted Republican one time. Florida has been a swing state for the last four elections. The polls overestimated the Democratic vote in 2016 by 0.80%, and overestimated the Republican vote in 2008 and 2012 by 1.02% and 2.38% respectively. Currently, Biden has a 2.2% lead in Florida. An overestimate of Democratic votes of similar size to the overestimate in 2012 would be enough to swing the state towards Trump.
Arizona
In the past three presidential elections, Arizona has voted Republican three times. Arizona has only been a swing state once in the last four elections (2016). The polls overestimated the Democratic vote by 5% in 2008 and 1.6% in 2012, and overestimated the Republican vote in 2016 by 0.45%. Currently, Biden has a 3.2% lead in Arizona. If the polls overestimate the Democratic vote as much as they did in 2008, it would be enough to swing Arizona towards Trump.
Nebraska CD-2
In the past three presidential elections, Nebraska CD-2 has voted Republican one time (with no data for 2012 due to the presence of a winner-take-all system in Nebraska). Nebraska CD-2 has never been a swing state, though Nebraska as a state in general has been a swing state for the past four elections. The polls underestimated the Republican vote in 2012, and overestimated the Republican vote in 2016 and 2008. Currently, Biden has a 3.8% advantage in Nebraska CD-2. An underestimation in the Republican vote would swing the state towards Trump. However, an overestimation in the Republican vote like the years 2016 and 2008 would help Biden win more convincingly if he was to win.
Alaska
In the past three presidential elections, Alaska has voted Republican three times. Alaska has never been a swing state. The polls underestimated the Republican vote in 2016, 2012, and 2008, and has never overestimated the Republican. Currently, Trump has a 4.2% advantage in Alaska. Historically, Alaska has voted Republican. In addition, since the polls have consistently underestimated the Republican vote in the past years, a similar trend would make it not be very surprising if Trump is to win Alaska. The only thing to take note of is if the Republican vote is overestimated, then the state may swing towards Biden.
South Carolina
In the past three presidential elections, South Carolina has voted Republican three times. South Carolina has never been a swing state. The polls underestimated the Republican vote in 2016 and 2012, and overestimated the Republican vote in 2008. Currently, Trump has a 5.2% advantage in South Carolina. Historically, South Carolina has voted Republican. Since Trump has a considerable lead in South Carolina, it would not be very surprising if he was to win the state. The only thing to take note of is if the Republican vote is overestimated, then the state may swing towards Biden.
Pennsylvania
In the past three presidential elections, Pennsylvania has voted Republican one time. Pennsylvania has been a swing state for the past four elections. The polls underestimated the Republican vote in 2016, and overestimated the Republican vote in 2012 and 2008. Currently, Biden has a 5.6% advantage in Pennsylvania, which is considerable. However, if there is an underestimate in the Republican vote, the race will be much closer, which would help Trump.
Discussion
The difference between election polls and the election results is significant, as the average absolute difference between the two values among this year's set of swing states is 3.10%. This difference is enough to swing the results of six of the states, as the margin in Florida, Georgia, Iowa, North Carolina, Ohio, and Texas are less than 3.10%, making these states competitive enough to swing given polling inaccuracies. Moreover, with coronavirus putting a tremendous amount of variance due to mail-in-ballots and other factors. Certain states, such as Alaska, have had historically high polling inaccuracies, as there is a 7.47% overrepresentation of the Democratic vote. However, this can be explained by how Alaska is very infrequently polled, and thus the sample size simply isn’t big enough to have accurate polling data.
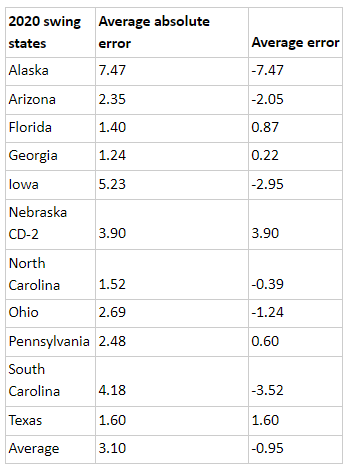 Overall, the polling for the swing states in this year's election have historically overrepresented Democratic voters by 0.95%. While not negligible, this suggests that polls don’t overwhelmingly overrepresent one party over the other, making this election even more unpredictable. Of the eleven states considered in the dataset to be 2020 swing states, six (Alaska, Arizona, Iowa, North Carolina, Ohio, South Carolina) have historically overrepresented the Democratic vote, and five (Florida, Georgia Nebraska CD-2, Pennsylvania, Texas) have historically overrepresented the Republican vote.
However, it is worth noting how overrepresentation tends to shift significantly towards one party for any given election. During the 2016 election, polling data for eight of the eleven swing states overrepresented Democratic voters. Overall, Democratic voters were 2.2% overrepresented. During the 2012 election, polling data for all eleven swing states overrepresented Republican voters. Overall, Republican voters were overrepresented by 2.57%. During the 2008 election, polling data for nine of the eleven swing states overrepresented Republian voters. Overall, Republican voters were overrepresented by 1.3%. Interestingly, these severe polling inaccuracies didn’t affect the 2004 election as heavily, as polling data for six of the eleven swing states overrepresented Republicans, while Democrats were actually overrepresented overall by 0.35%.
Overall, the polling for the swing states in this year's election have historically overrepresented Democratic voters by 0.95%. While not negligible, this suggests that polls don’t overwhelmingly overrepresent one party over the other, making this election even more unpredictable. Of the eleven states considered in the dataset to be 2020 swing states, six (Alaska, Arizona, Iowa, North Carolina, Ohio, South Carolina) have historically overrepresented the Democratic vote, and five (Florida, Georgia Nebraska CD-2, Pennsylvania, Texas) have historically overrepresented the Republican vote.
However, it is worth noting how overrepresentation tends to shift significantly towards one party for any given election. During the 2016 election, polling data for eight of the eleven swing states overrepresented Democratic voters. Overall, Democratic voters were 2.2% overrepresented. During the 2012 election, polling data for all eleven swing states overrepresented Republican voters. Overall, Republican voters were overrepresented by 2.57%. During the 2008 election, polling data for nine of the eleven swing states overrepresented Republian voters. Overall, Republican voters were overrepresented by 1.3%. Interestingly, these severe polling inaccuracies didn’t affect the 2004 election as heavily, as polling data for six of the eleven swing states overrepresented Republicans, while Democrats were actually overrepresented overall by 0.35%.
 While this reinforces the idea that polls don’t inherently overrepresent one party over the other, the clear partisan overrepresentations over a given election mean that while we can’t predict which political party will be overrepresented in the polls, we certainly know that such overrepresentation will be significant and consistent among most states. There are a couple takeaways here. The first is that 2016 wasn’t an outlier. The polls weren’t any more wrong in 2016 as they were in 2012 and 2008, as the amount of error tended to be the same. The error that occurred in 2016 just happened to swing the election, something that will remain a legitimate possibility for 2020, especially considering the circumstances of the pandemic making this election more volatile and harder to predict than ever before. The second is that there seems to be a trend towards polling becoming more partisan. While such a conclusion is impossible to make definitively with a sample size of four elections, the shift from relatively mild inaccuracies in 2004 and 2008 to the large errors in 2012 and 2016 seem to indicate this. This seems counterintuitive, as polling methods would be expected to improve over time. One potential theory is that increasing political polarization is introducing large amounts of bias into polling, as certain participants may be less likely to engage in polling data. This is by no means a definitive conclusion, especially with the limited sample size of elections, but it is a trend that we should be looking for. Finally, it’s notable that many of the states that are considered swing states this election used to be safe Republican states. Of the eleven swing states this year, five have voted Republican in the last three elections straight, whereas none of the states have voted Democrat in the last three elections straight. This suggests that Trump has been losing ground, and states would have normally been considered swing states have now been declared safe states for Biden. Trump certainly has an uphill battle on election day, but given the historical overrepresentation of one party over the other in polling data, anything is possible.
Sources
Roos, D. (2020, July 23). 5 Presidents Who Lost the Popular Vote But Won the Election. https://www.history.com/news/presidents-electoral-college-popular-vote.
Rotondi, J. P. (2020, October 7). What Are Swing States and How Did They Become a Key Factor in US Elections? https://www.history.com/news/swing-states-presidential-elections.
Writer, S. A. M. J. A. N. E. S. C. H. | S. (2017, March 20). Pennsylvania among 4 states where Trump and Clinton spent the most time and ad money. https://lancasteronline.com/news/politics/pennsylvania-among-4-states-where-trump-and-clinton-spent-the-most-time-and-ad-money/article_f5a04ada-0d85-11e7-b8fb-df4677007213.html.