How Trump’s Approval Rating Has Changed Based On COVID
Intro
COVID-19 has hit the United States hard—the epicenter of the pandemic in the world has been inside America since July. The Trump administration’s handling of the virus it has had has caused his approval ratings to have changed significantly. In some states, citizen’s perceptions of the administration’s failure to deal with the virus have caused his approval numbers to sink, while in others, a “rally ‘round the flag” phenomenon boosted leader approval. Other factors, like the pandemic leading to a downturn in the economy and millions filing for unemployment, also play a significant part in the approval ratings of our 45th president. Let’s take a closer look.
Methodology
To accurately measure the change in the President’s approval rating, we needed a pre-COVID baseline. The date of March 12th, 2020 was chosen as this was the day before COVID-19 was officially declared a national emergency. The two dates of June 20th, 2020, and October 10th, 2020 were then chosen as the two dates for which we would compare the change of his approval ratings to the COVID death rate. October 10th was chosen as it was the most recent data we could find as of the starting of this blog post and June 20th was chosen as it was exactly 100 days into the crisis and roughly a halfway mark as well. The period from March 12th to June 20th will be here on out be referred to as Period 1, the period from June 20th to October 10th will be here on out referred to as Period 2, and the period from March 12th to October 10th will be referred to as Period 3.
Once we had established the periods for which we would analyze trends across, data for Trump’s approval rating and cumulative COVID death rates were gathered. We used data reported by the CDC on state COVID deaths. Figures for Trump’s approval rating on a state by state basis was taken from Civiqs (Donald Trump: Job Approval Registered Voters) -- a sample-based public opinion poll that polls registered voters.
Two separate linear regressions were then performed on the data gathered. One comparing the cumulative COVID death rate to approval rating change during Period 1 and one comparing the cumulative COVID death rate to approval rating change across Period 3. The variable change in approval rating will henceforth be abbreviated as ARC.
Results
Running a linear regression model that uses total deaths per 100k as of 10/10 as the predictor and the change in the approval rating from 3/12 to 10/10 as the response variable yields us a regression equation of ARC = -0.04779 + 0.000237 deaths-hat with an r^2 value of 12.88%. The states that deviated the most from this equation and left high residuals were Alaska, New Jersey, New York, and Ohio.
Running a linear regression model that uses total deaths per 100k as of 6/20 as the predictor and the change in the approval rating from 3/12 to 6/20 as the response variable yields us a regression equation of ARC = -0.05465 + 0.000137 deaths-hat with an r^2 value of 5.02%. The states that deviated the most from this equation and left high residuals were Alaska, Connecticut, Massachusetts, New Jersey, and New York.
COVID deaths across America were not distributed evenly across times. Many states on the east coast and the Northeast -- Connecticut, Rhode Island, New Hampshire, etc. -- saw much larger increases in COVID deaths during Period 1 than Period 2. Likewise, many states in the South and many parts of the Western United States -- Idaho, Alabama, Texas, South Carolina, etc. -- were mostly spared from COVID deaths during Period 1 but experienced a sharp increase of deaths during Period 2.
Donald Trump’s net approval rating was observed to have dropped since March 12th in nearly all 50 states. However, more specifically, the change in the net approval rating across period 3 is less than the drop across Period 1. In most states, his approval rating loss during Period 1 was at least partially negated by a subsequent increase in approval rating during Period 2.
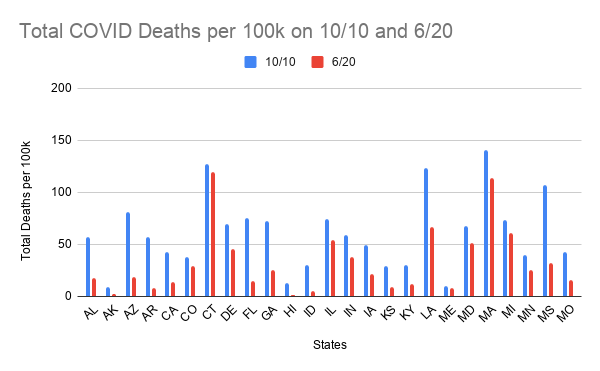
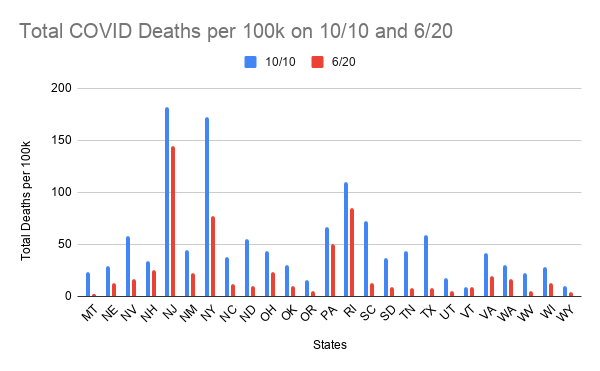 Figure 1: Graph describing the total deaths per 100k population for each state on 6/20 and 10/10
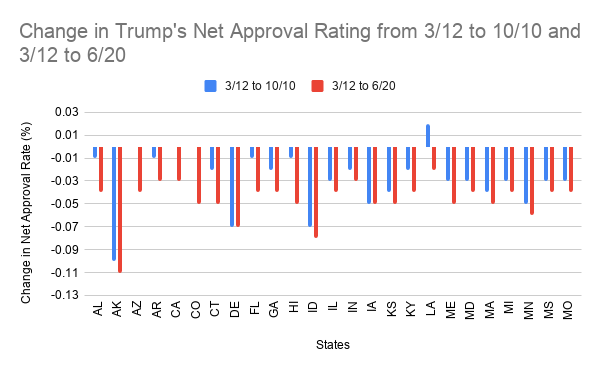
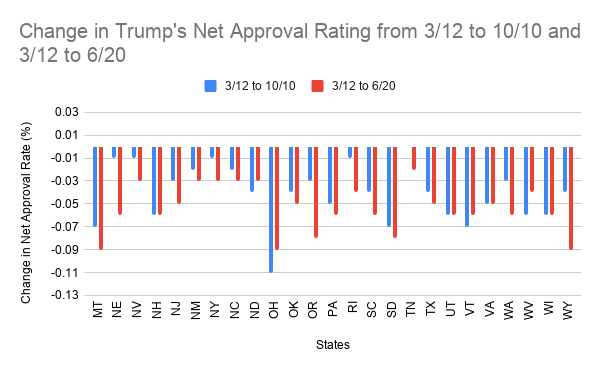 Figure 2: Graph describing Trump’s net approval rate for each state as it changed from 3/12 to 6/20 and 10/10
Discussion
Both linear regressions conducted concluded a small r-squared value for both models. This indicates that the variation that occurred in COVID death rates could not adequately predict the variation in ARC indicating that there is no smooth linear relationship between these two variables. Although Trump’s approval rating decreased in nearly all 50 states, there was little correlation to COVID death rates indicating that voters didn’t necessarily perceive the effects of COVID the same as the actual effects. Additionally, the effects and impacts associated with COVID played a larger role in voter’s perceptions of how the administration had handled the crisis rather than just the death rate itself. Individual states may have attributed more or less of the responsibility of handling this crisis to the President versus other local statewide elected officials. Finally, many other events and factors also occurred throughout this period that may have affected the President’s approval rating outside of solely just the COVID crisis.
However, even with this limited correlation, a few states jump out as outliers. Notably, Alaska, New Jersey, and New York were outliers across both linear regression models. The reason for Alaska’s deviation away from the other states may have to do with the relatively low population density of the state allowing for minimal COVID casualties while the state experiencing massive drops of around 10% in Trump’s approval rating. New York and New Jersey both experienced some of the highest COVID death rates in the country but did not experience similarly high drops in Trump’s approval rating -- only roughly 3% on average. This may be caused by both states already being heavily leaving towards the Democrats with Trump’s net approval rating being roughly -30% in both states even before the pandemic.
Of note are two states, one which had the most positive change in net presidential approval rating and one which had the most negative change. President Trump’s net approval rating dropped 11% in Ohio from March 12th to October 10th. By October 10th, Ohio had a cumulative death rate of 43 deaths per 100K population, which happens to be the median of the data set. One thing of note, Ohio has also been considered a swing state in 2020 making Trump’s approval rating drop quite precarious for the president.
On the other hand, Trump’s net approval rating increased by 1% in Louisiana, the only state in which it increased between March 12th and October 10th. Louisiana, by October 10th, had a cumulative death rate of 123 deaths per 100K population. This was the fifth-highest death rate in the nation, which is why we were puzzled to see that the president’s approval rating increased in this state. Factors that may have contributed to this condition may lie in other actions the president has taken to help alleviate natural disasters in Louisiana and that Louisiana is already a reliably Republican state with Trump enjoying positive net approval ratings.
The possibility of error in the findings must be considered. Several factors could have caused this error. First and foremost, it’s important to note that, we had to consider the fact that the CDC is a government agency, and as such, it is possible that the data they present may be skewed to portray the pandemic in the light that the current president wants. Additionally, in our search for reliable data sources, we found a cite from the New York Times that presented COVID-19 data that conflicted with the data from the CDC. We had to make a judgment call and decide to go with the data provided by the CDC, as they had the specific information that we needed for our analysis. Another possible source of error lay in our decision to use March 12th as the baseline to compare the other two dates to. We chose it because it was right before the entire nation was acutely aware of the pandemic, however, we failed to consider the fact that people were already getting sick by then and were hearing about how other countries were hit by COVID-19. Finally, it may have been more useful to consider the number of deaths per 100K population in the last seven days leading up to a certain date, rather than the cumulative death rate, as the more recent deaths would be the ones showing up on the daily news, more regularly haunting the residents’ thoughts and affecting their perceptions of the pandemic.
References
CDC COVID Data Tracker. (n.d.). Retrieved from https://covid.cdc.gov/covid-data-tracker/#compare-trends_totaldeathsper100k
NATIONAL Donald Trump: Job Approval Registered Voters. (n.d.). Retrieved October 10, 2020, from https://civiqs.com/results/approve_president_trump?annotations=true&uncertainty=true&zoomIn=true