How has Trump’s Positive COVID-19 Test Affected his Chances?
Introduction
President Trump’s positive COVID-19 test deep into his 2020 reelection campaign season is a truly unprecedented event in what has turned out to be a surprisingly stable race. With a vast majority of models (including our own) favoring a Biden win in November, Trump’s reelection campaign was already in trouble, we now question how a positive COVID-19 test could shape the election models. In this blog post, we use the win percentage given to Trump by FiveThirtyEight, the Economist, and our own model in order to identify possible shifts or trends in the forecasts.
Background
In an election cycle marred by a global pandemic, unusually stable polls, and possibly the worst Presidential debate in modern history, one of the most noteworthy and talked about moments may have come in the form of a tweet. In the early hours of Friday, October 2, just days after attending the first of the Presidential debates, President Trump broke the news on Twitter that he and first lady, Melania Trump, had tested positive for COVID-19. As the sun rose on a new day, news feeds were flooded with images of the President boarding a helicopter en route to Walter Reed Medical Center. A wild three-day hospitalization culminated in a Regeneron pumped Trump parading around the group of supporters that encircled the hospital from the back of his motorcade.
This all comes at a time when most voters disapprove of the White House’s COVID-19 response. Through the month of September, Trump held a dismal 41.17% average daily COVID-19 response approval rate and a disapproval rate of 54.63 % according to FiveThirtyEight. During that span, a number of interviews were made public in which the President admitted that he had not only known about the severity and possible nationwide effects of the virus weeks before the shutdown but had sought to downplay the severity of the virus to the public. with public approval of the President’s handling of the pandemic dwindling, were his chances of being reelected further affected by the positive COVID-19 test? Do voters trust a president who couldn’t prevent the infection of his own cabinet to continue to lead the country through this pandemic? Would a strong recovery from the virus reassure voters of his COVID rhetoric and grow support? To answer these questions, we compared our model with FiveThirtyEight and The Economist to determine whether or not the models picked up a shift in public opinion following the President’s diagnosis.
Methodology
We compared the win percentage that the three models gave to President Trump in the week prior and the week after his diagnosis, to determine if there was a significant change. With Trump officially announcing the positive diagnosis on October 2, we went back to September 26 and up to October 9. We created an expected trend based upon the data prior to the diagnosis. We used this expected trend line to test whether the variation from the trend was statistically significant. We did the same thing with the Republican National Convention, but to see if the usual ‘Convention Bounce’ would be present this year, or with the same strength as has been previously, since it was not open to the public. Note: Both FiveThirtyEight and The Economist make additional convention adjustments beyond what is shown in polling. The ORACLE of Blair does not make such an adjustment.
Results and Analysis
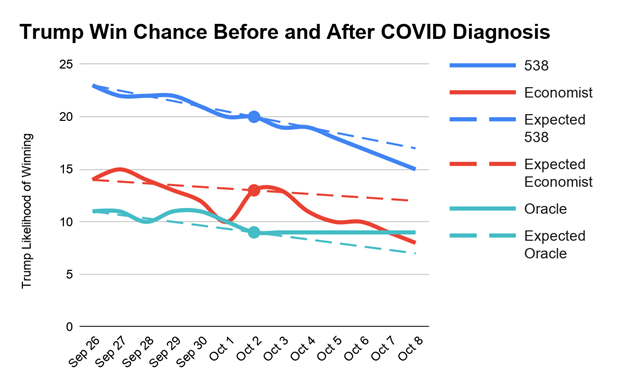
One week before the news of Trump’s diagnosis was released to the public, 538’s model gave the President a 23% chance to win, The Economist gave him a 14% chance, and The Oracle an 11% chance. At no point did any of the three models reach a higher win percentage for Trump in the following two weeks. By October 2, all three models had dipped by 3%, 1%, and 2% respectively. That downward trend continued for two of three models, where both 538 and The Economist dipped an additional 5% in the week after the diagnosis. Meanwhile, The ORACLE had not dipped at all. By October 8, 538 gave Trump a 15% chance (8% drop), The Economist gave an 8% chance (6% drop), and The ORACLE gave a 9% chance (2% drop).

Point on Oct. 2 represents COVID diagnosis
Figure 1. Graph of Models Before and After COVID Diagnosis
As Figure 1 depicts, both FiveThirtyEight and The Economist finish the week below where they would be expected to based upon the results from the week before the diagnosis. ORACLE’s prediction in fact slightly boosted Trump’s win percentage above the expected trend line. The t-test of the FiveThirtyEight’s variance from the trend line has a p-value of 0.6046, which is not considered statistically significant. However, the t-test for The Economist has a p-value of 0.0486, so at a 0.05 significance level, the difference can be considered statistically significant, but it is close. A t-test on The ORACLE’s output reveals a p-value of 0.0948, which is not significant, but The ORACLE did not dip after the diagnosis as expected, it stayed the same. There are many factors that could have altered the polling average such as decreased variance as the election draws nearer. From the data, we cannot conclude that COVID-`19 had an impact on the model predictions.
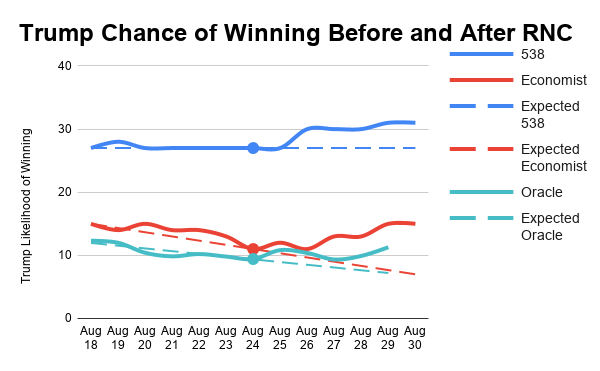
One week before the RNC, 538’s model gave the President a 27% chance to win, The Economist gave him a 15% chance, and The Oracle an 12.4% chance. By August 24th, 538 had remained the same, The Economist went down by 4%, and The Oracle went down by 2.59%. That downward trend did not continue for all three models, where all three demonstrated a switch of direction, and they all grew in the week following the RNC. By August 30, 538 gave Trump a 31% chance (2% growth), The Economist gave an 15% chance (no change), and The ORACLE gave a 11.29% chance (1.11% drop).

Point on Aug. 24 represents RNC
Figure 2. Graph of Models Before and After RNC
Until August 24th, all three models maintained similar trends to the expected line, but following the 24th, each model demonstrated a bump (fig 2). A t-test of the FiveThirtyEight data set returns a p-value of 0.0075, while a t-test of The Economist returns a p-value of 0.0064, our Oracle model provides a p-value of .0103. Each model returns values that represent a statistically significant deviation from their expected output. Much like the COVID diagnosis results, it is unclear what other factors are at play, but unlike figure 1, the bounce is both visually and statistically significant, so it’s likely that the RNC resulted in a bounce in the win probability for Trump.
Conventional wisdom would dictate that news as significant as Trump’s positive COVID-19 test would change the race, yet it has turned out to have little effect on Trump’s chances of winning. His chances of winning have decreased since the test, but not significantly enough to be outside of what is expected. The chances of winning can be reasonably explained by the by the elections getting nearer, there was not a significant enough spike in the forecasts to imply a positive COVID-19 test had any effect on his chances of winning. While the race has remained unusually stable, Trump’s chances increased slightly after the RNC. It appears that Trump may not win the election after all, but it was not because of the positive COVID-19 test and rather his campaign overall.
References
Agiesta, Jennifer. “Trump Bounces into the Lead.” CNN, Cable News Network, 25 July 2016, edition.cnn.com/2016/07/25/politics/donald-trump-hillary-clinton-poll/index.html.
Bycoffe, Aaron, et al. “How Americans View The Coronavirus Crisis And Trump's Response.” FiveThirtyEight, 25 Oct. 2020, projects.fivethirtyeight.com/coronavirus-polls/.
Economist, The, et al. “President-Forecasting the US 2020 Elections.” The Economist, The Economist Newspaper, 2020, projects.economist.com/us-2020-forecast/president.
Rappeport, Alan. “New Poll Reflects a Post-Convention Bounce for Hillary Clinton.” The New York Times, The New York Times, 1 Aug. 2016, www.nytimes.com/2016/08/02/us/politics/clinton-convention-poll.html.
Silver, Nate. “2020 Election Forecast.” Edited by Micah Cohen et al., FiveThirtyEight, 26 Oct. 2020, projects.fivethirtyeight.com/2020-election-forecast/.
