Why Demographics Hurt Trump
Introduction
It is no question that candidates perform better among certain demographic groups. For example, minorities tend to vote more Democratic than whites and Evangelicals, who tend to vote more Republican. Because of these differences, each state’s demographics are taken into account in our model’s predictions.
We experimented to see how the predicted election results would change if demographic influence was completely omitted from individual state predictions. Currently, the model makes a prediction of a state based on two main factors: what the current polls say, and a combination of BPI and demographics. The weights between the current polls and BPI/demographics is dependent on the number of polls conducted in that region with the following equation:
$$\frac{1.92}{\pi}arctan(0.65 * numPolls)$$
From the equation, if a state has no polls, the BPI and demographics will have all of the weight. However, as a state accumulates more polls, the overall weight of the polls approaches 96%. Because of this, the weight that demographics have on the overall prediction is dependent on the number of polls that were conducted in that state.
Original Demographic Equation

To calculate the influence of demographics on the expected Trump vote, we first obtained a set of 38 demographics for each state. We then tried multiple combinations of possible demographics to maximize our R2 value while using a meaningful set of demographics and no overfitting.
We ended up choosing four variables: white non-hispanic percentage, non-religious percentage, college degree percentage, and urbanicity. To calculate the weights of each demographic to predict the expected Trump vote, we performed a multiple regression with the results of previous elections as the dependent variable and the four demographics as the independent variables.
Therefore, for the experimental model without demographics, these four factors will influence how much results change in each state. In states with extreme values for any of the four demographic factors, and especially states with fewer polls, we expect to see a significant change in the prediction when demographics are removed from the model.
Results
Analysis
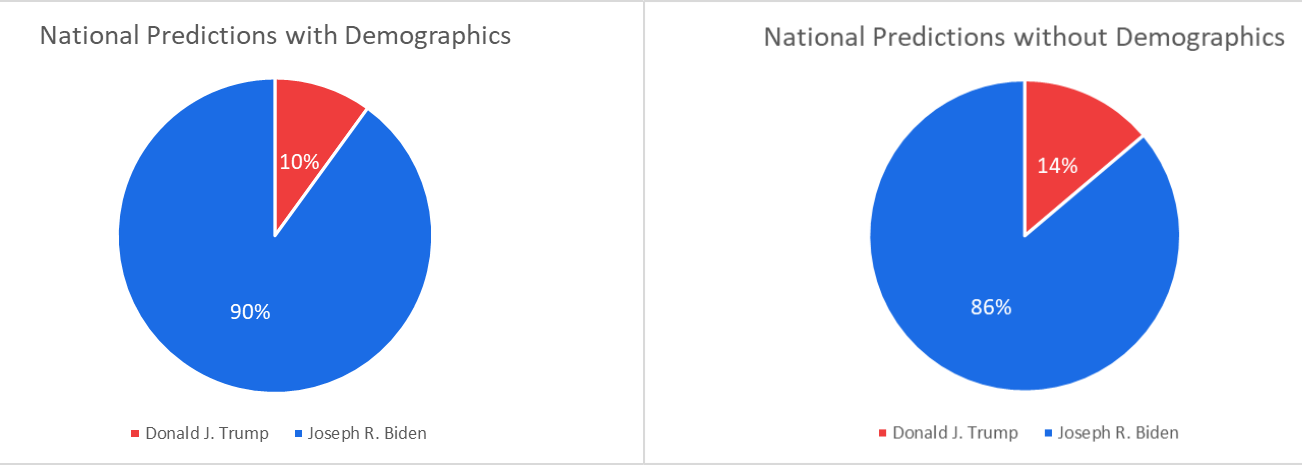
We ran our simulation on October 20 with no demographic contribution, we see that Trump’s national win percentage increases by 4% from 10% to 14%. Additionally, by investigating the win percentage of each state individually, we find that Trump’s win percentage increases in most states. If we observe the Differences in Predictions map, we see there is no real pattern for differences between similar states, but rather that the change seems to be spread out throughout various states across the country.
Why does our data put Trump as generally ahead in these states?
After a closer examination of the coefficients in the demographic equation, we noticed that there were three variables that detracted from Trump’s expected vote and only one variable, white non-hispanic %, that increased Trump’s expected vote. On top of this imbalance of variables, each of the variables that detracted from Trump’s expected votes had a higher coefficient than the white non-hispanic %. Due to this glaring imbalance of demographics decreasing Trump’s expected vote, it is not very surprising that omitting demographics would have a general trend of helping Trump and hurting Biden. The equation is structured in a way that would require a state to have an exceedingly high white non-Hispanic %, but very low values for non-religious %, college degree %, and urbancity %, in order to help Trump.
Example #1 (Pro-Trump): Texas
Let’s look at a specific example of a state where not including demographics would favor Trump. In Texas, 41.20% of the population is white non-Hispanic and 73.45% has a college degree. Because college degree % has a larger coefficient than white non-Hispanic %, and there is a higher % in college degree than white non-Hispanic, just on the basis of these two variables demographics will favor Biden by decreasing Trump’s expected vote. By including the other variables that further detract from Trump’s expected vote, and it is even more clear that demographics decrease Trump’s expected vote in Texas. Therefore, by omitting demographics, Trump’s expected vote will increase in Texas.
Demographics of Texas:
| White Non-Hispanic | Nonreligious | College Degree | Urbanicity |
|---|---|---|---|
| 41.20% | 18.00% | 73.45% | 11.35211736 |
Example #2: When Demographics Screwed the Model Up - Case Study of Maine
Before polls were conducted in Maine, our model that combined BPI and Demographics predicted that Trump had a 56% chance of winning Maine. This was due to Maine’s demographic composition of 93% white non-hispanic, combined with low urbancity, college degree %, and nonreligious %, made it quite favorable for Trump to win based on our demographic formula. Additionally, the BPI of Maine is -2.89, which means Democrats do have a clear advantage in the state, but not a very large one, so the extreme demographics were able to counteract the BPI and showed Trump ahead without any polls. However, once polls were being conducted in Maine, the balance abruptly shifted away from Trump and began to heavily favor Biden, as would be expected.
Demographics of Maine:
| White Non-Hispanic | Nonreligious | College Degree | Urbanicity |
|---|---|---|---|
| 93.00% | 31.00% | 24.90% | 9.377285439 |
Example #3 (Pro-Biden): Wisconsin
Another intriguing example from the no demographics model is Wisconsin. This state is considered a very valuable swing state that Donald Trump won in 2016 by under 25,000 votes. However, Joe Biden has a comfortable lead of 7.4 percentage over Donald Trump in the state. In our official model, Joe Biden has a decent lead, and the no demographics model gives him even more of an advantage. The reasoning for this change is caused by Wisconsin’s high proportion (80.90%) of non-hispanic whites in its population. This demographic favors Trump in the formula, so when demographics are removed, the prediction for Wisconsin swings toward Biden. Additionally, since Wisconsin is a close state, any change in vote percentage will cause a significant change in win percentage, which is why Wisconsin is very blue on the Differences in Predictions Map.
Demographics of Wisconsin:
| White Non-Hispanic | Nonreligious | College Degree | Urbanicity |
|---|---|---|---|
| 80.90% | 25.00% | 29.50% | 10.46581868 |
Conclusion
Overall, it seems that removing demographics from the individual state predictions does seem to help Donald Trump by raising his win probability from 10% to 14%. Without demographics, a majority of states go towards Trump, including most swing states, but the key states of Wisconsin and Pennsylvania actually swing towards Biden. We do not know yet, but it could be possible that our experimental model without demographics could be more accurate than the official model with demographics.