Very Varied Variances: State-by-State Comparison of Variances Between ORACLE and FiveThirtyEight
Introduction
Variance is a measure of spread in data. When creating models, the goal is to hit a “goldilocks variance.” Too much variance and it becomes hard to make a certain conclusion since the model includes so many diverse possibilities. On the other hand, too little variance places too much trust in the hands of the model, which can’t possibly account for all of the things that we can’t yet predict. In other words, variance is a way to account for uncertainty in your data by analyzing a range of possibilities; our goal as statisticians is to estimate how much uncertainty exists and have our variance reflect that.
Our analysis today compares the state-by-state variances between our model and FiveThirtyEight’s. Through this analysis, we hoped to gain insight into the comparative benefits and drawbacks of one model compared to the other. At the same time, we could also use this data to make inferences about the assumptions and the knowledge informing the creation of FiveThirtyEight’s model.
Methods
We easily accessed our model’s variance data, but FiveThirtyEight’s was a different story. After trying to find their variance and contacting their team, we ultimately resorted to estimating the variance based on their state models.
To estimate FiveThirtyEight’s variance, we assumed that the 40,000 election simulations for each state followed a normal distribution. This is important because normal distributions follow predictable patterns; 95% of the data will fall within two standard deviations of the mean. Using the 100 simulations that FiveThirtyEight presented on their website, as well as their predicted vote share (the mean of all their simulations), we found those points that contained approximately 95% of the data, and were equidistant from the mean.
The distance from one of those points to the mean became our estimate for two standard deviations. We divided that estimate by two and then squared it to calculate an estimated variance (variance is the square of the standard deviation).
Data
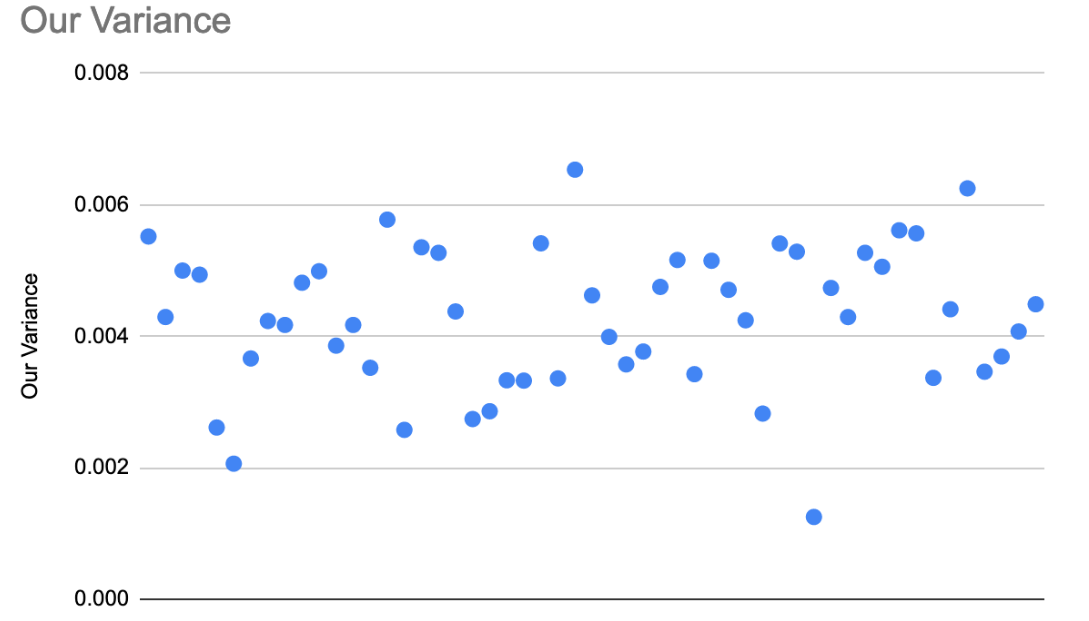
 Figure 1(a) shows ORACLE’s variance for each state or district.
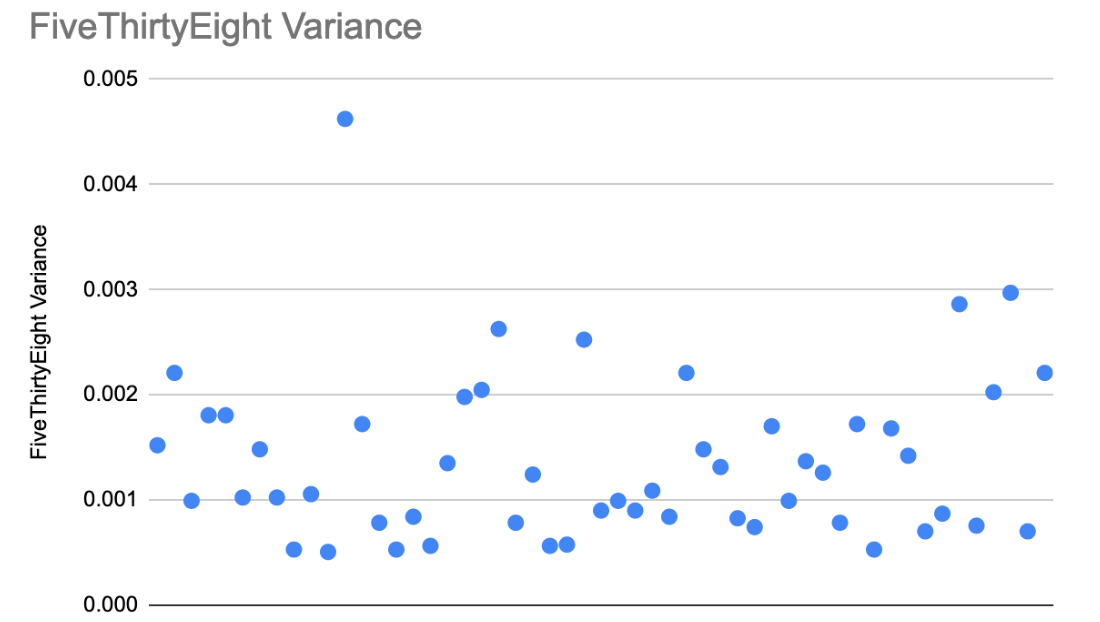
 Figure 1(b) shows FiveThityEight’s variance for each state or district.
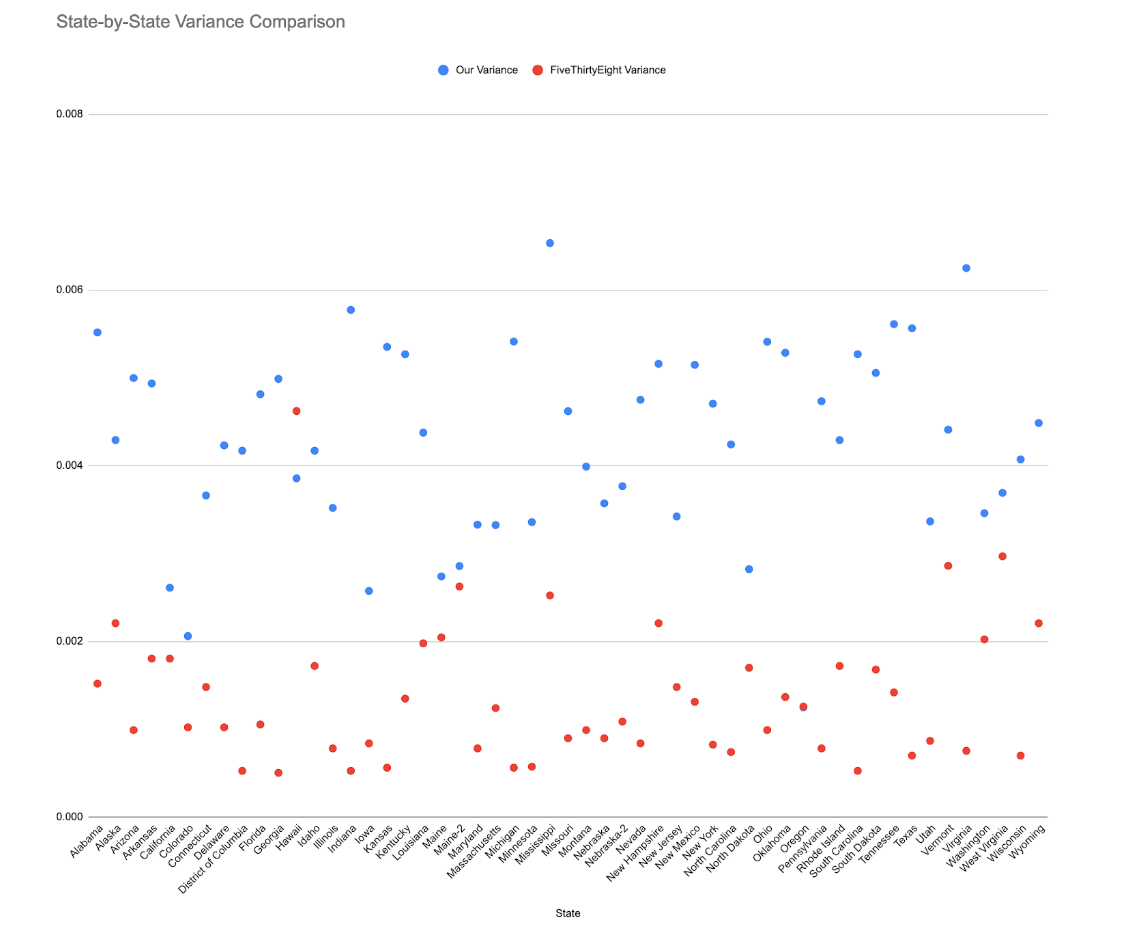
 Figure 2 shows the state-by-state variances for ORACLE and FiveThirtyEight.
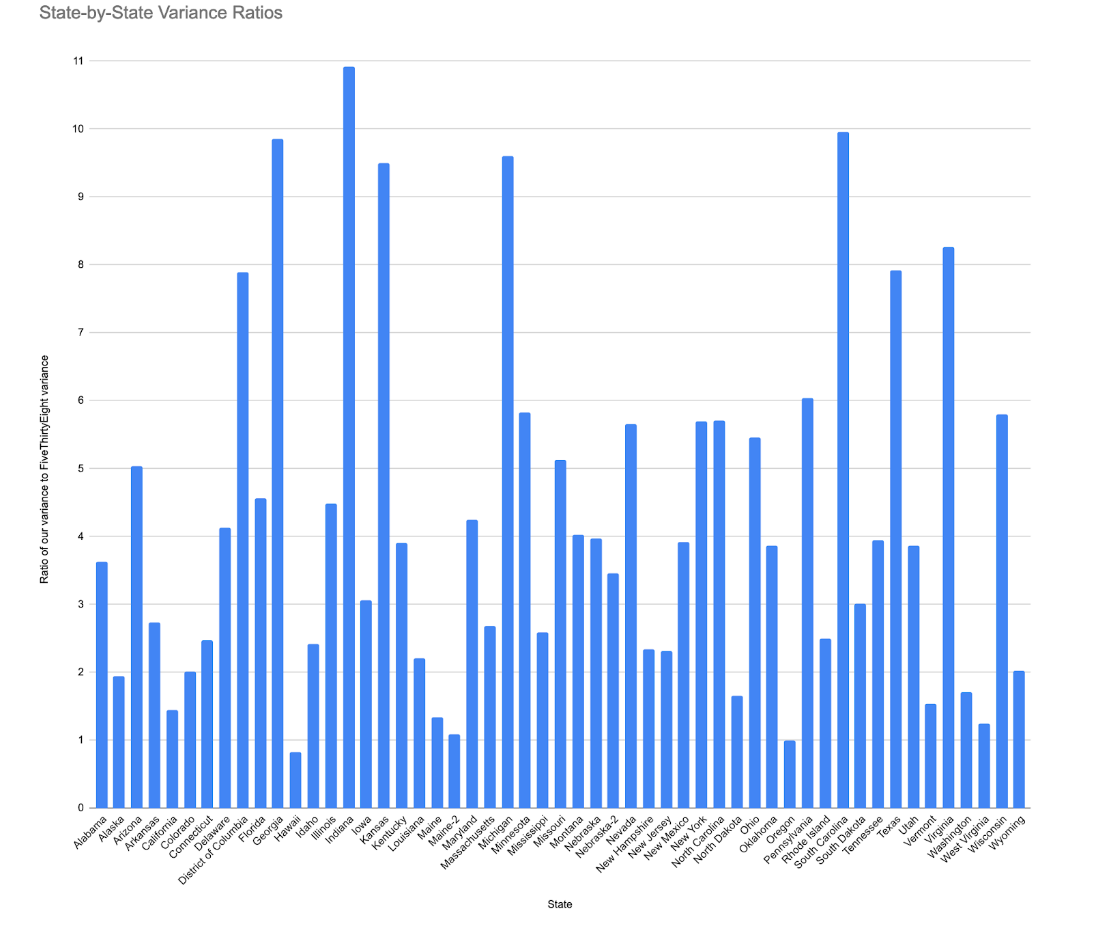
 Figure 3 shows the ratio of ORACLE’s variance to FiveThirtyEight’s variance for each state or district.
Explanation
Targeting the states with outlying differences in variance gives us some preliminary insight into the models’ differences. The five states with the largest differences in variation between our model and 538's were Indiana, Georgia, Kansas, Michigan, and South Carolina. There are two underlying factors for these differences, which both center around Oracle’s calculation of its variance and how few variables were involved. First, the four typically red states in this collection (the typically blue state is Michigan) have some of the highest Cost-of-Voting (CoV) indices in the country. Second, three of these states are relatively close in the polls (Michigan, South Carolina, Georgia) and two have flipped their party in the past 3 election cycles (Michigan, Indiana).
This all goes to show that there’s likely higher concentrations of undecided voters in these states. As undecided percentages and the CoV index are two of the four main factors in determining Oracle’s variance, it is easy to see why Oracle’s variances are unusually large. The competitiveness of the state also explains why FiveThirtyEight’s variance might be unusually low. Their variance is likely tied more heavily to the number of polls (as more polls reduces uncertainty), and these states are, for the most part, places where pollsters are looking for possible surprises come election day. More polls reduces FiveThirtyEight’s uncertainty, explaining the large gap.
This logic also holds for the unusually small ratios. Take Hawaii, the only state for which FiveThirtyEight’s variance is higher than ours. The state has one of the lowest CoV indices in the country, and is historically blue with Biden dominating in the polls, making Oracle’s calculated variance pretty low. On the other hand, because it’s less competitive, very few polls are actually conducted there, which is why FiveThirtyEight calculates unusually high variance there (at least relative to their other calculated variances). The combination of these two forces results in this one scenario where FiveThirtyEight’s variance is actually greater than ours.
Overall, the model produced by FiveThirtyEight was far more precise than our model, as displayed in Figure 2. When examining each state in FiveThirtyEight's model, we tended to see tighter clustering and a distinct lack of outliers in their visual representations. FiveThirtyEight's results were more compact and deviated very little from the mean. Based on our estimations, their average variance was only 0.00136, whereas our model’s average variance was 0.00428. While these numbers seem small, Oracle’s variance—its estimate of the uncertainty we need to account for—is 4 times higher than FiveThirtyEight’s. However, there is an explanation for this widespread difference beyond arbitrary decision making or flaws in the calculations; maybe our model simply is less certain.
Not only did we most likely have fewer factors contribute to our model, but this is the first year that we have introduced some of them. FiveThirtyEight’s model takes into account factors such as economic uncertainty, influence of important media, national drift, and correlated-state error. Oracle does not consider the exact same factors or implement them in the same way. Furthermore, FiveThirtyEight weighs different factors in accordance with their own statistics, which will not be the same as Oracle’s. The methodology associated with each model contributes to the difference in variances and also the ideal range of the variances. For example, Oracle wanted the standard deviation to be around 5 percentage points in order to maximize the accuracy of the predictions. In all likelihood, FiveThirtyEight’s desired or expected variance was smaller, as a function of their established modelling process and confidence in their ability to account for most intervening factors.
Do the model differences we have observed account for all of the fourfold difference in variance? Probably not, but analyzing them and breaking them down gives us valuable insight into how a model’s methods influence its outcomes. The implementation of any model will lead to different variances and will change based on the expectations of the creators. One is not necessarily better than the other, but Oracle’s model could look to improve by analyzing additional election-changing components.
